







Unifying the leading Latin America credit & account limit management, now 70% faster
Customer support teams had to chase 150+ credit limit fields across a mainframe, screen by screen, while handling live...
 Read case
 Due to a non-disclosure agreement, information on this project and outcome is limited.

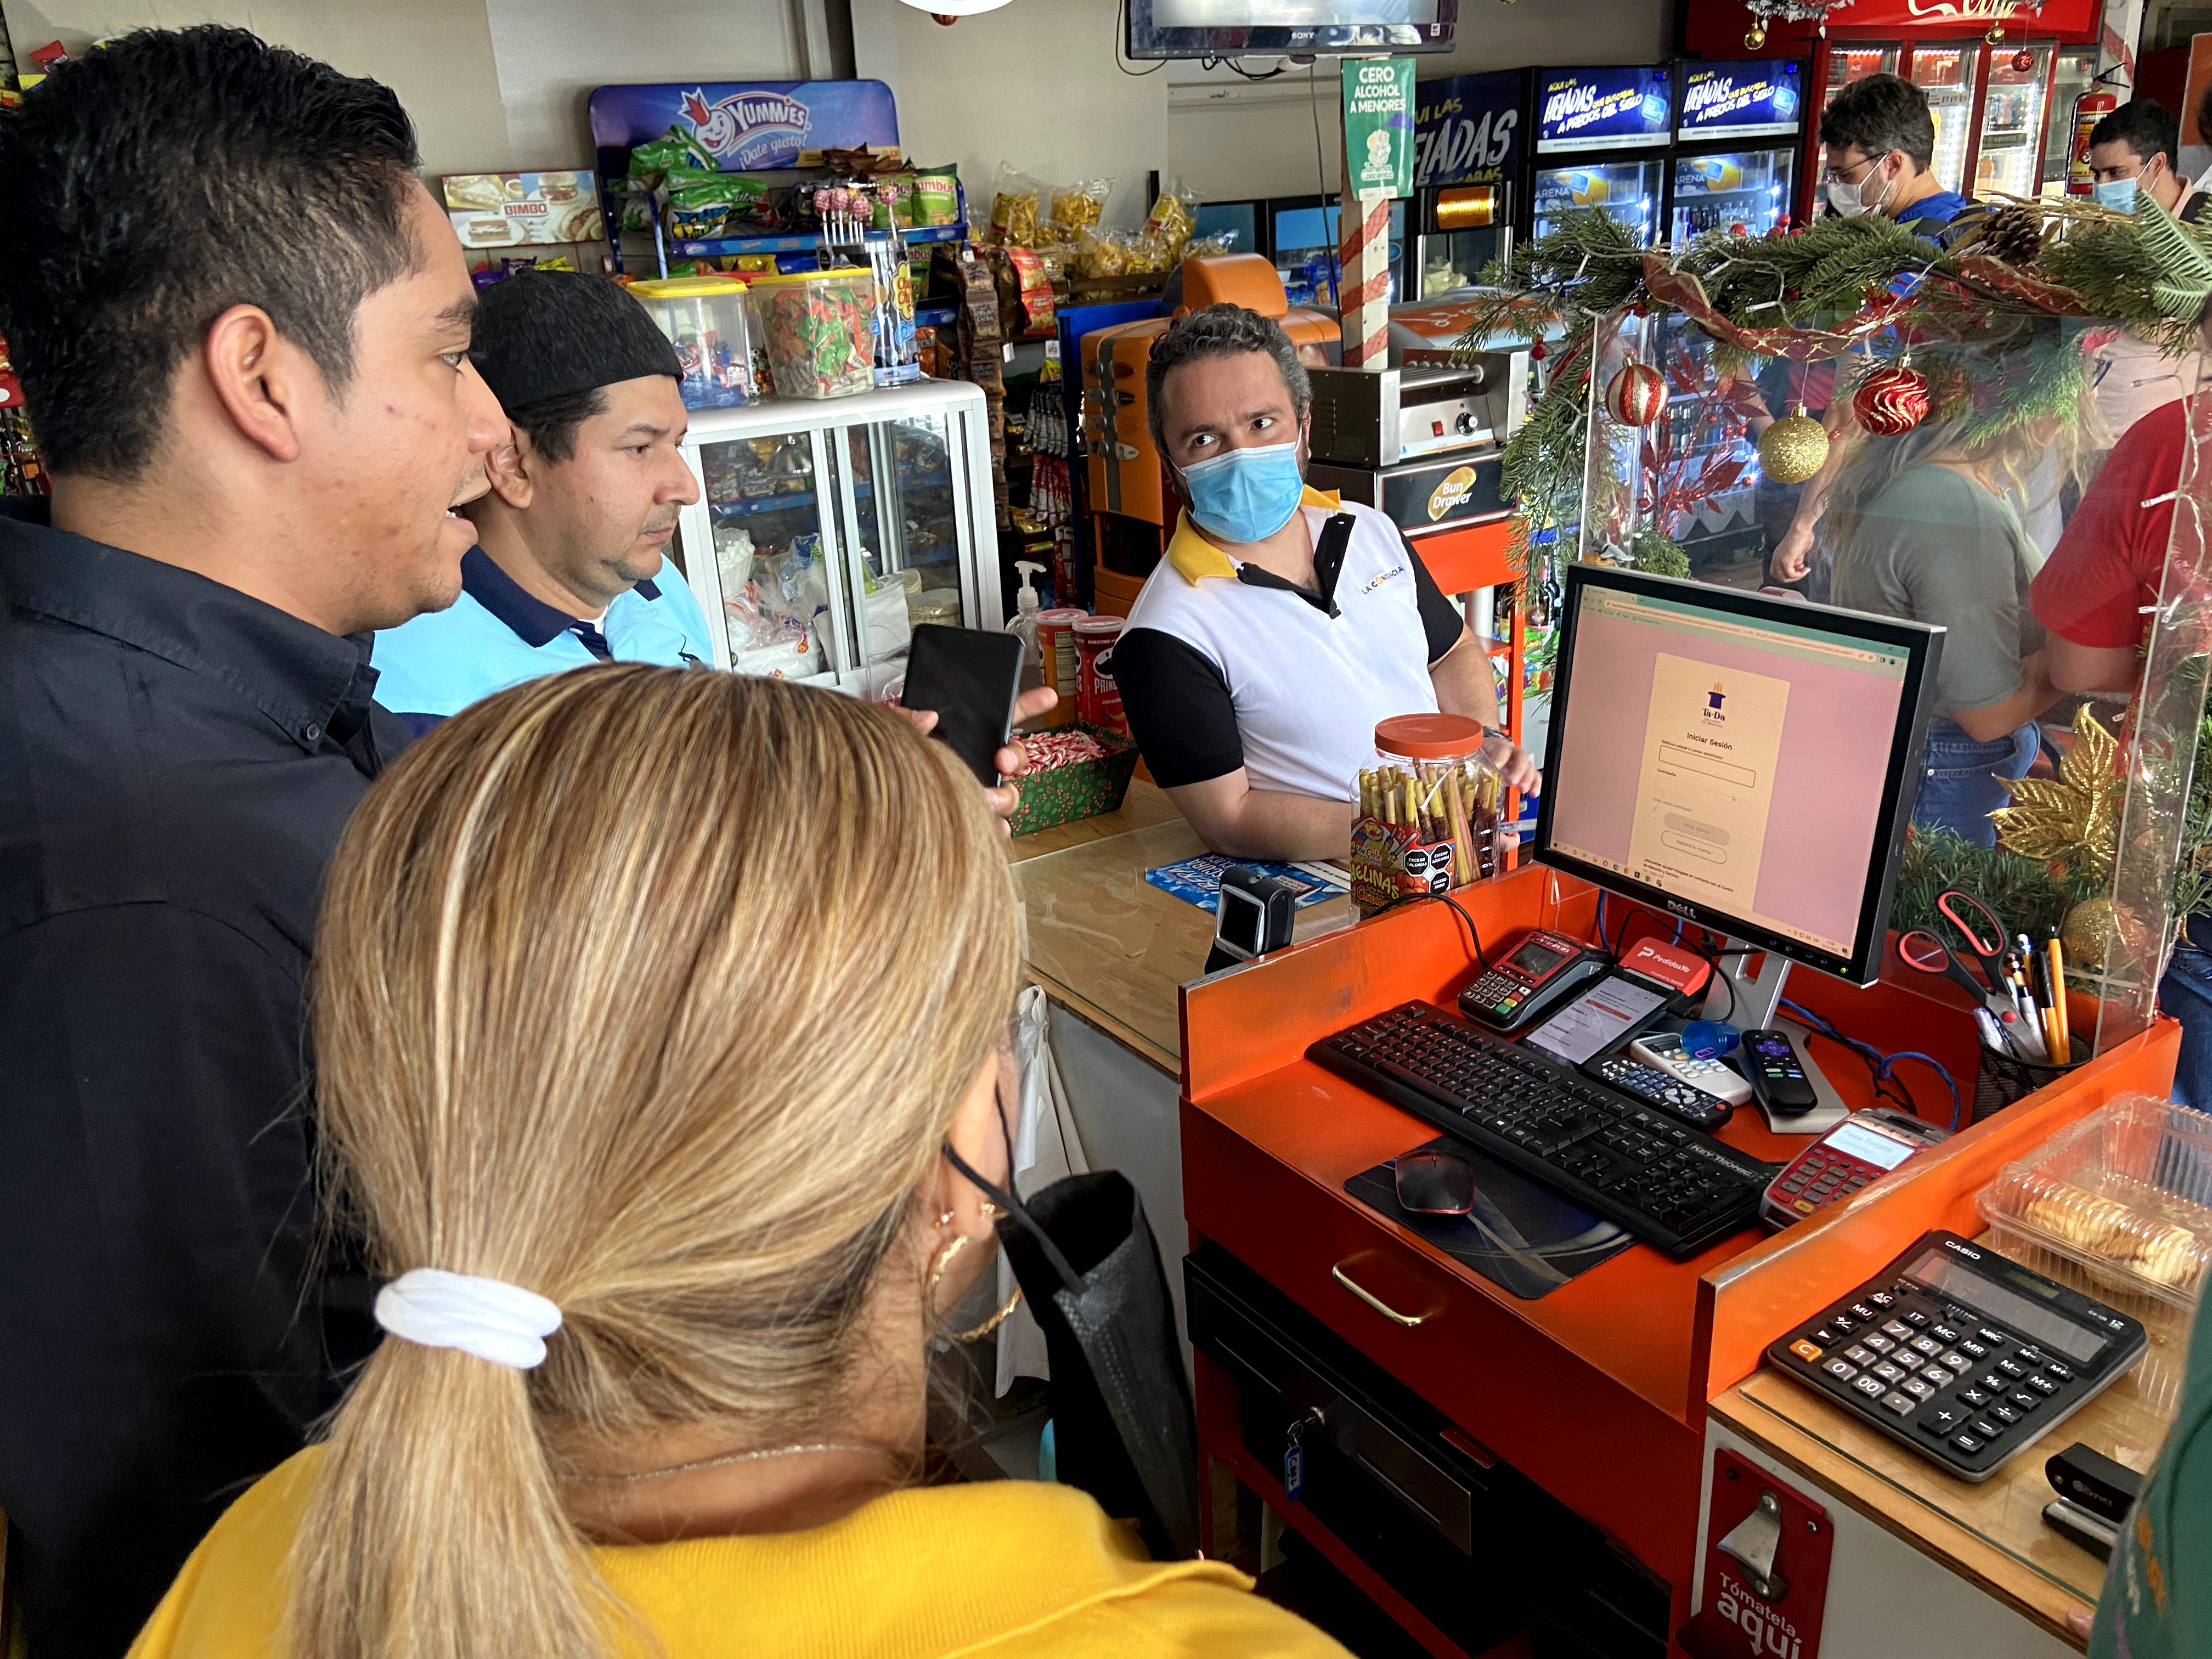
TaDá Delivery is AB InBev’s global direct-to-consumer delivery platform: one unified experience across Latin America and South Africa. I joined during the MVP pilot, before launch, and owned the UX of the B2B tool where store managers receive D2C orders and run daily operations. I supported the launch with the existing designs, then we shipped the next version in 3 markets. New components from this work were later adopted into the company’s global design system.

Two SaaS tools and a different
brand in each of 13 countries
One brand and one platform across
Latin America and South Africa

Two tools, a different brand per country. Across 13 countries, store managers ran daily operations on two SaaS tools, each country under a different brand.
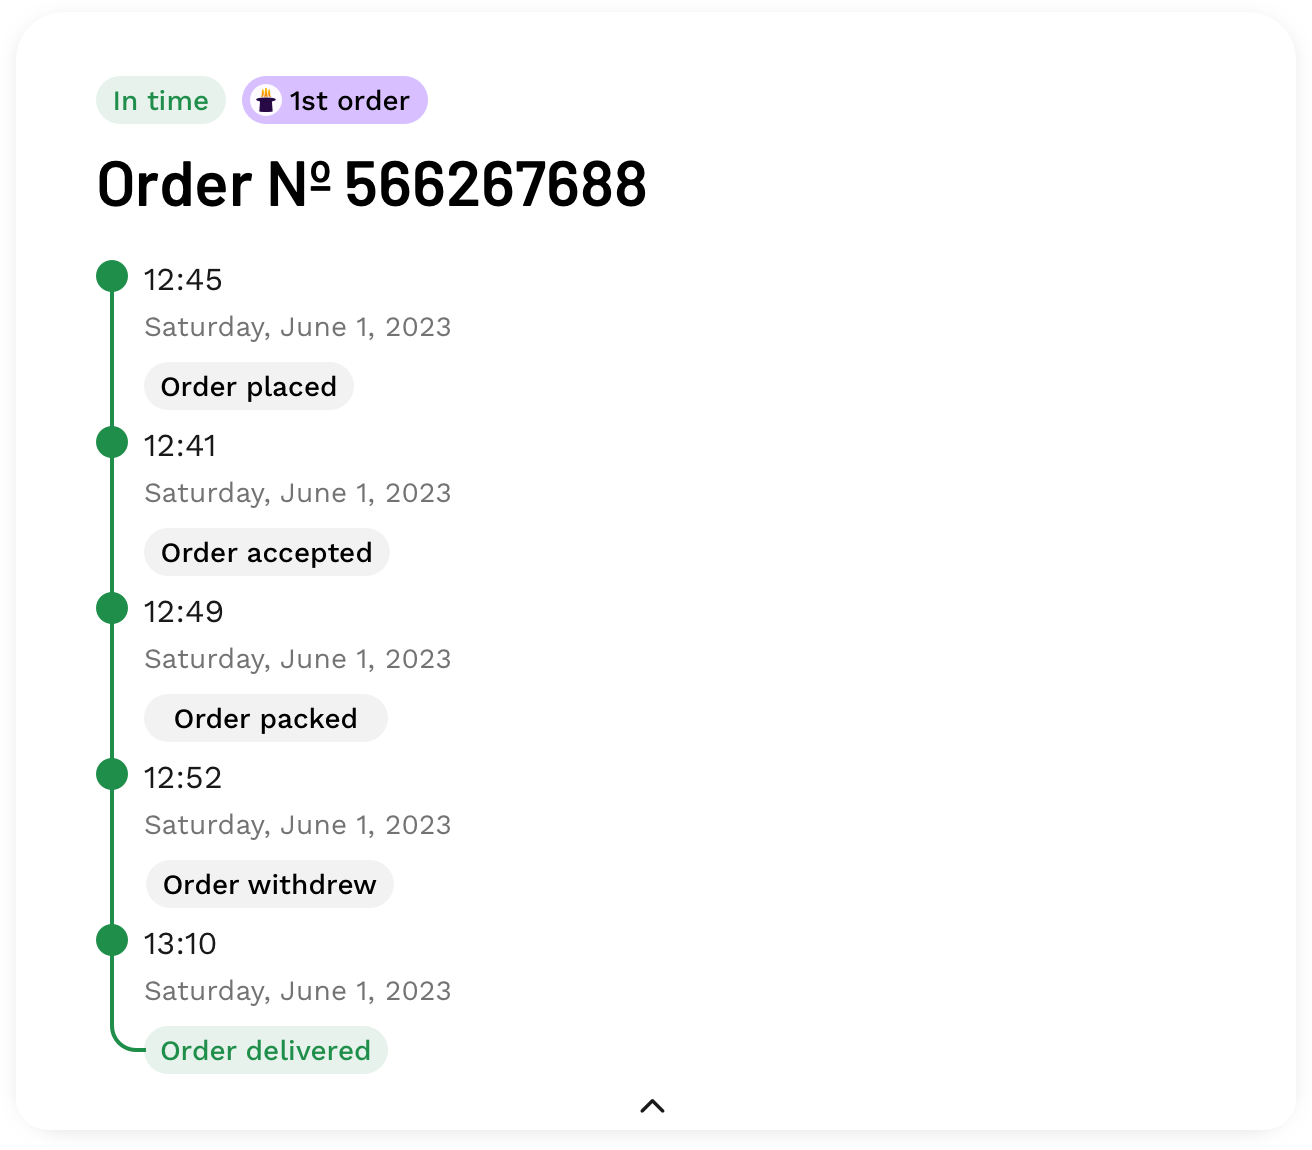
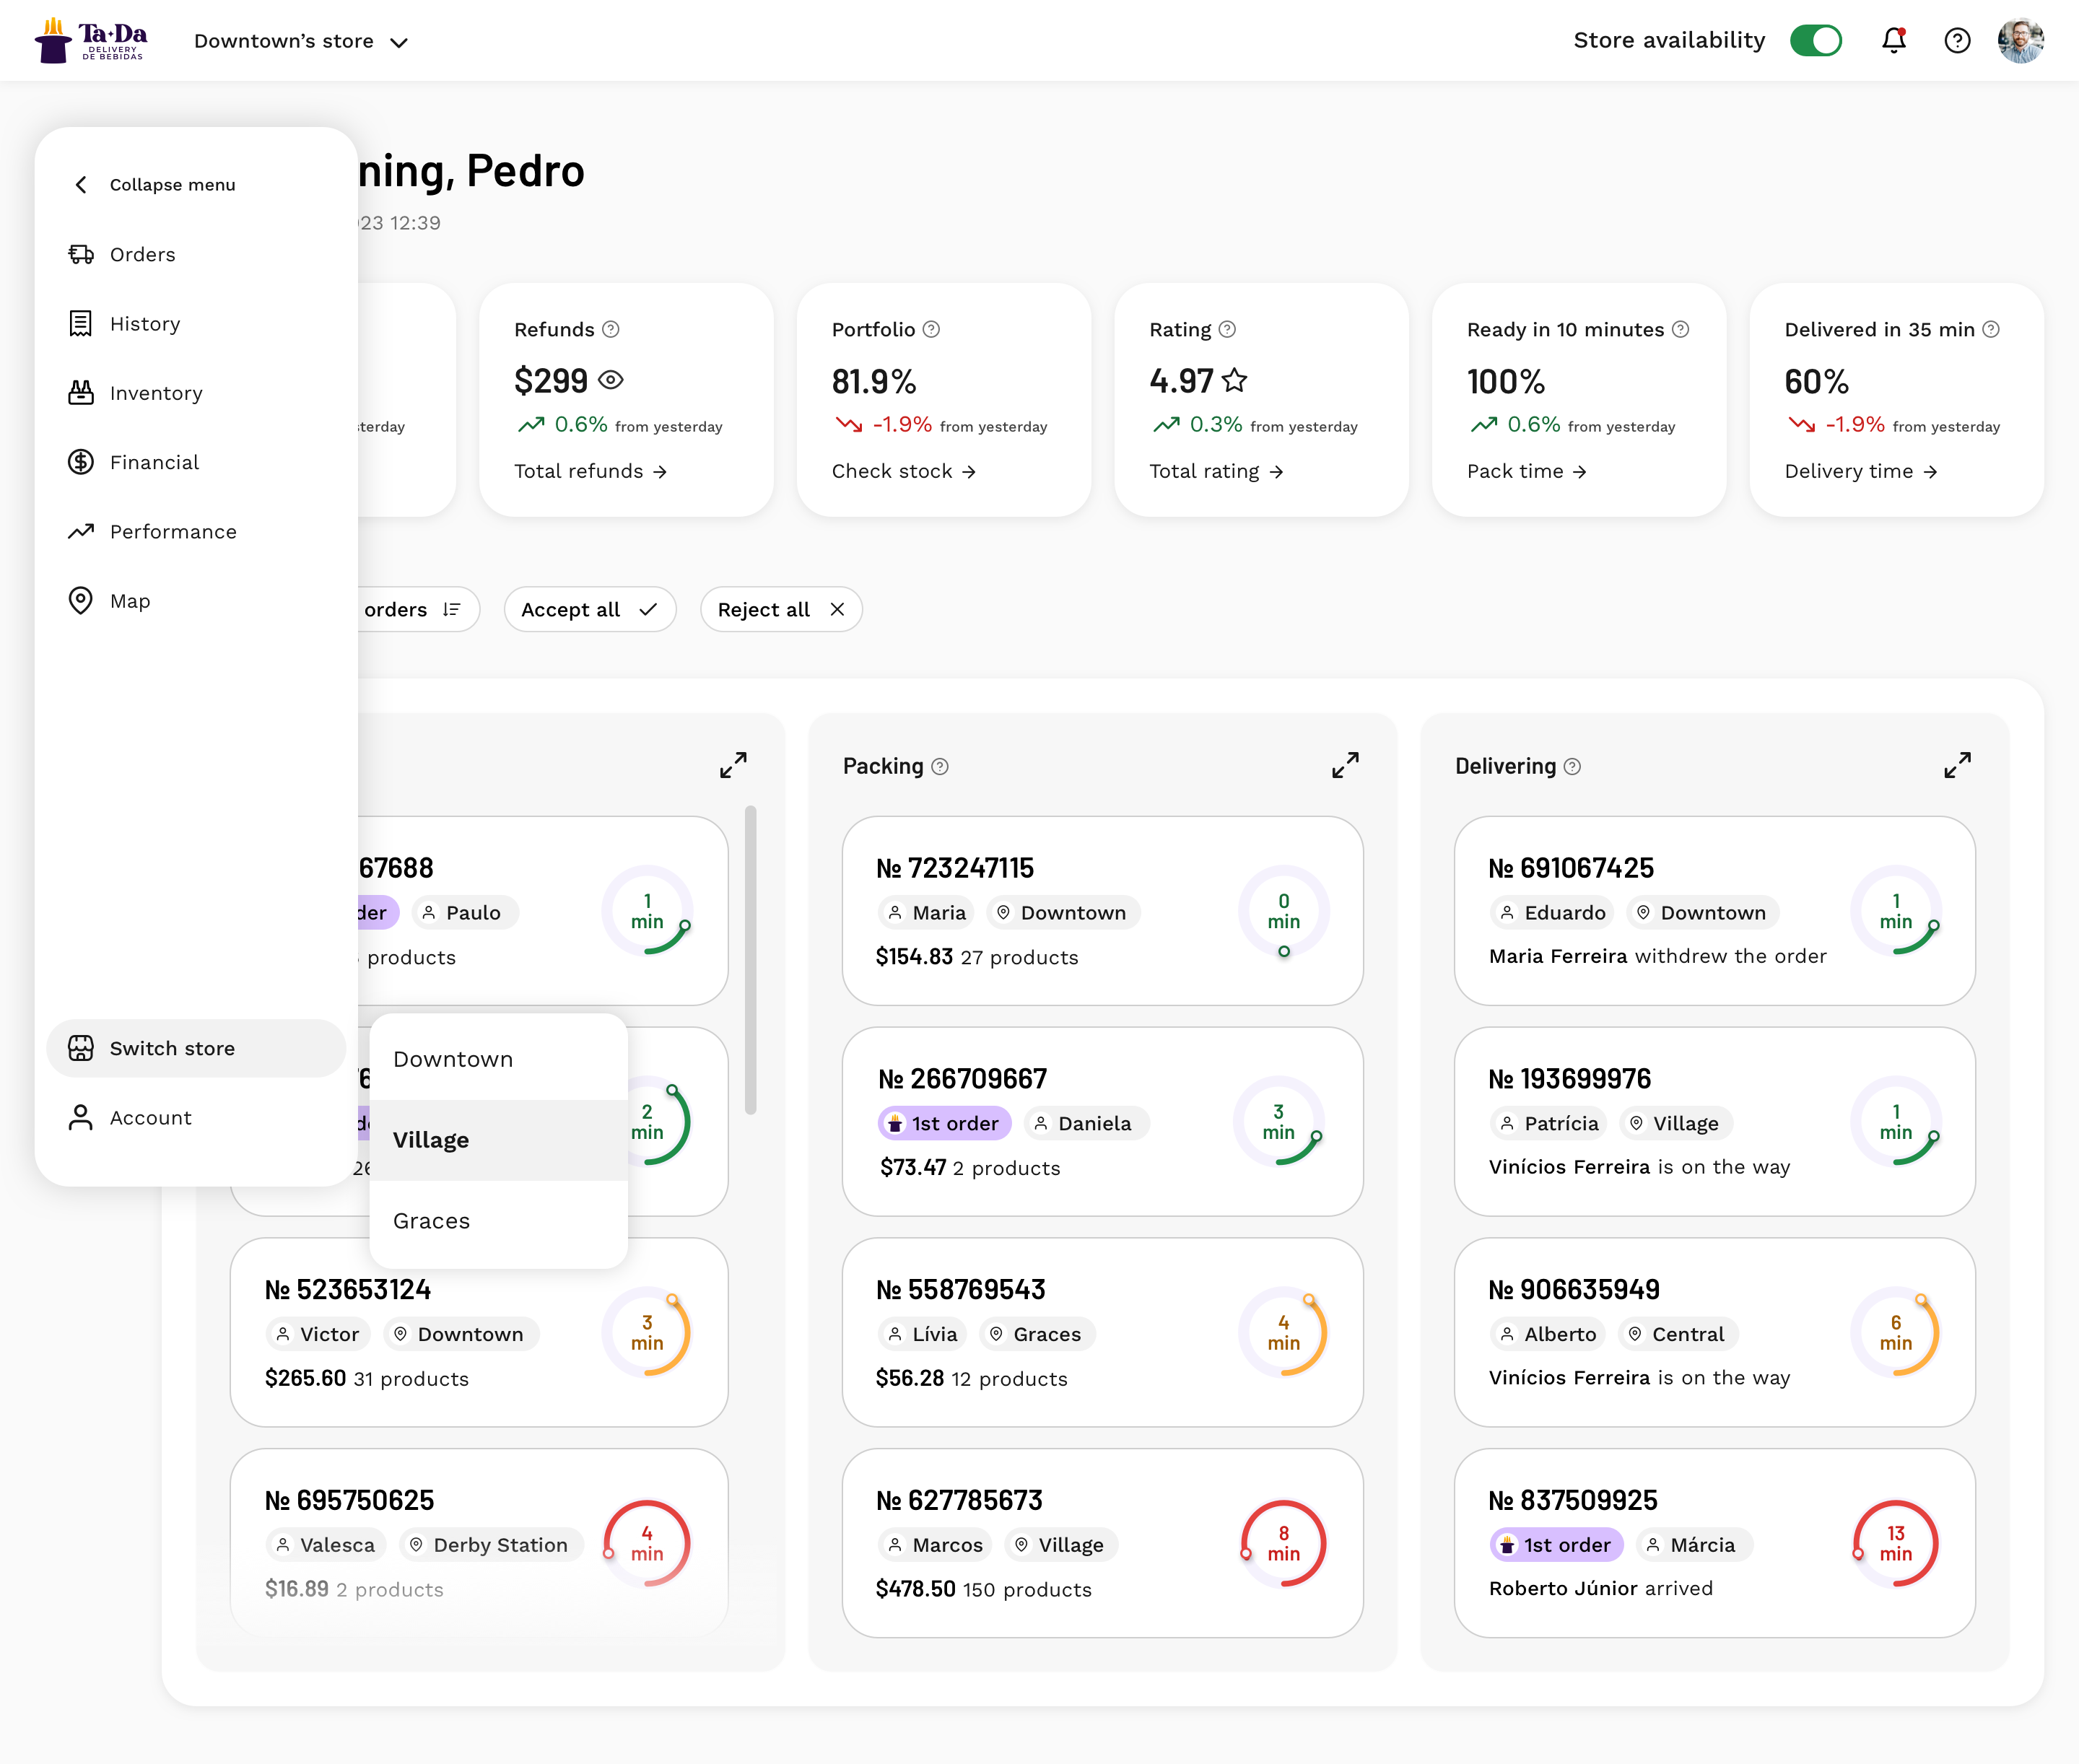
Steps and status that didn’t match reality. The result: unclear steps, and status updates that didn’t match real-life processes.

One platform, many rules. Languages, currencies, regulations and ID verification changed from country to country, and the design had to work within all of them.
Two kinds of stores. AB InBev-owned stores and external partners, with or without multiple locations. One interface had to serve both.
Not every store had a desktop. Some stores had no room for a desktop or laptop, so I explored responsive layouts for the main pages from the start.

One platform where there were two tools. We launched in the pilot market and expanded to three more while I was on the project. The platform later reached 13 countries.
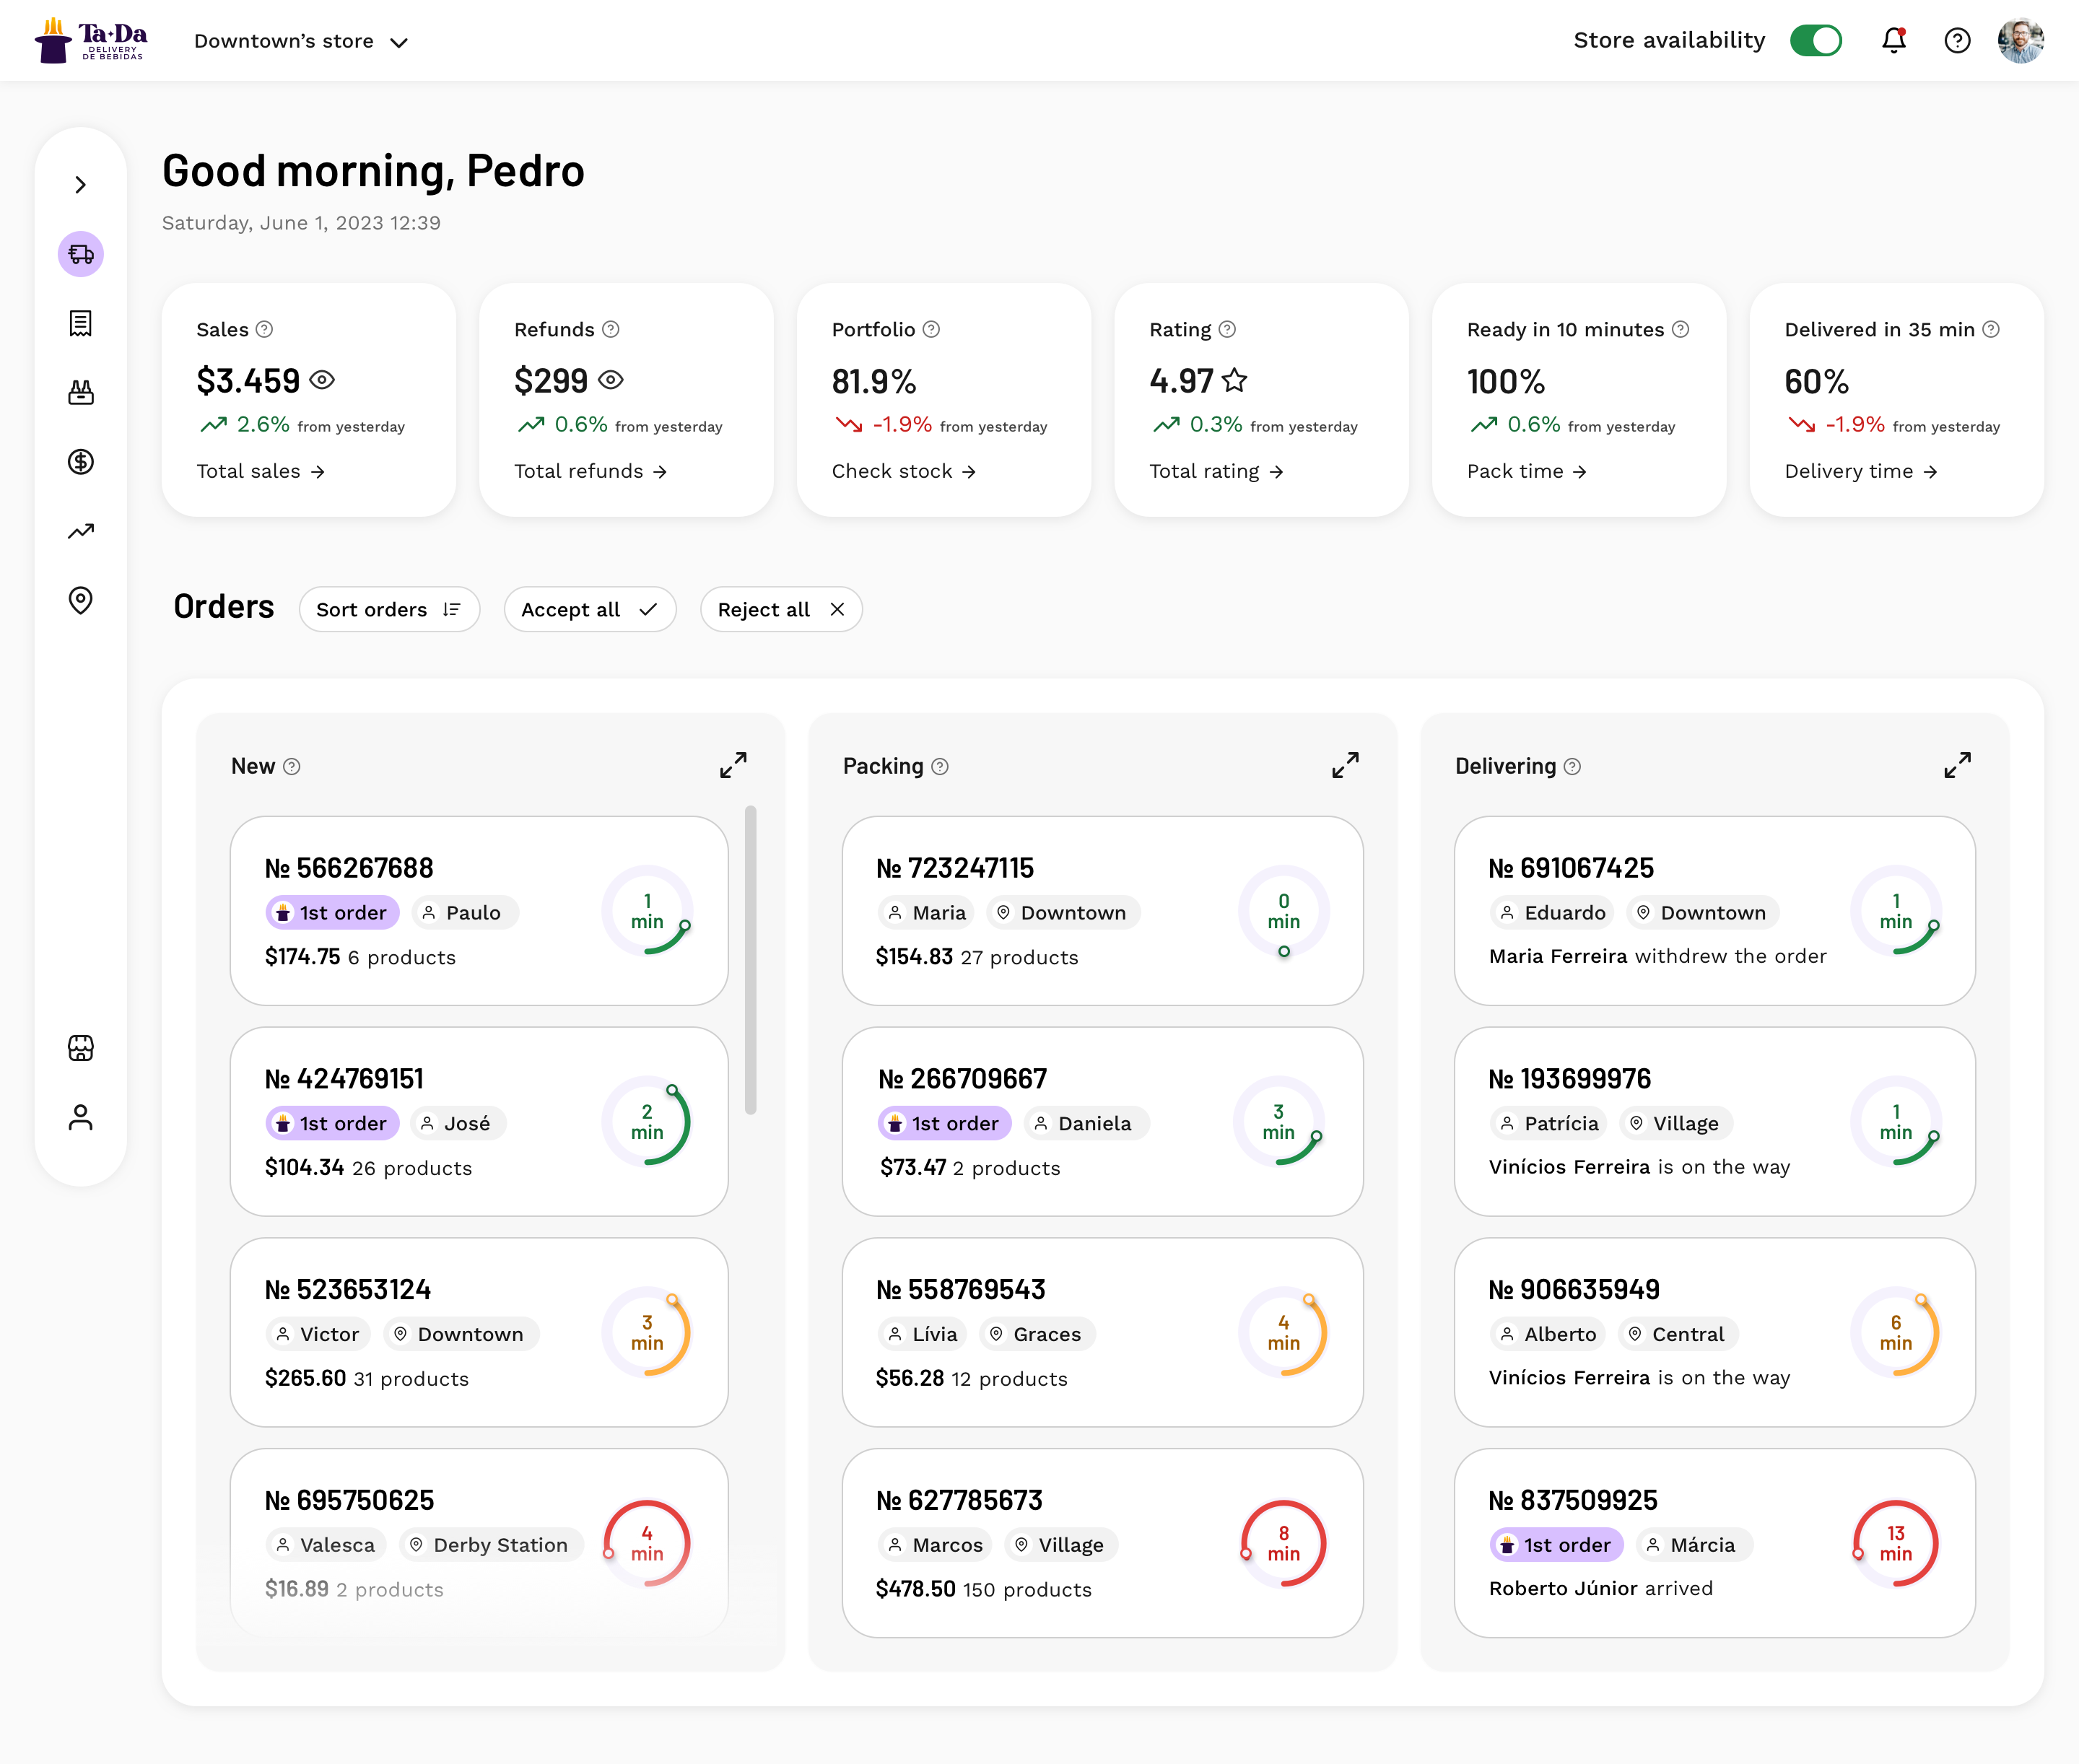
Clear steps, live status. Store managers now see every order, its stage and its status in one place, in real time.
22 of 26 fixes shipped. I led the mapping of 26 UX problems and inconsistencies. I designed 22 of them, and we shipped them to production. Components from this work were later adopted into AB InBev’s global design system.
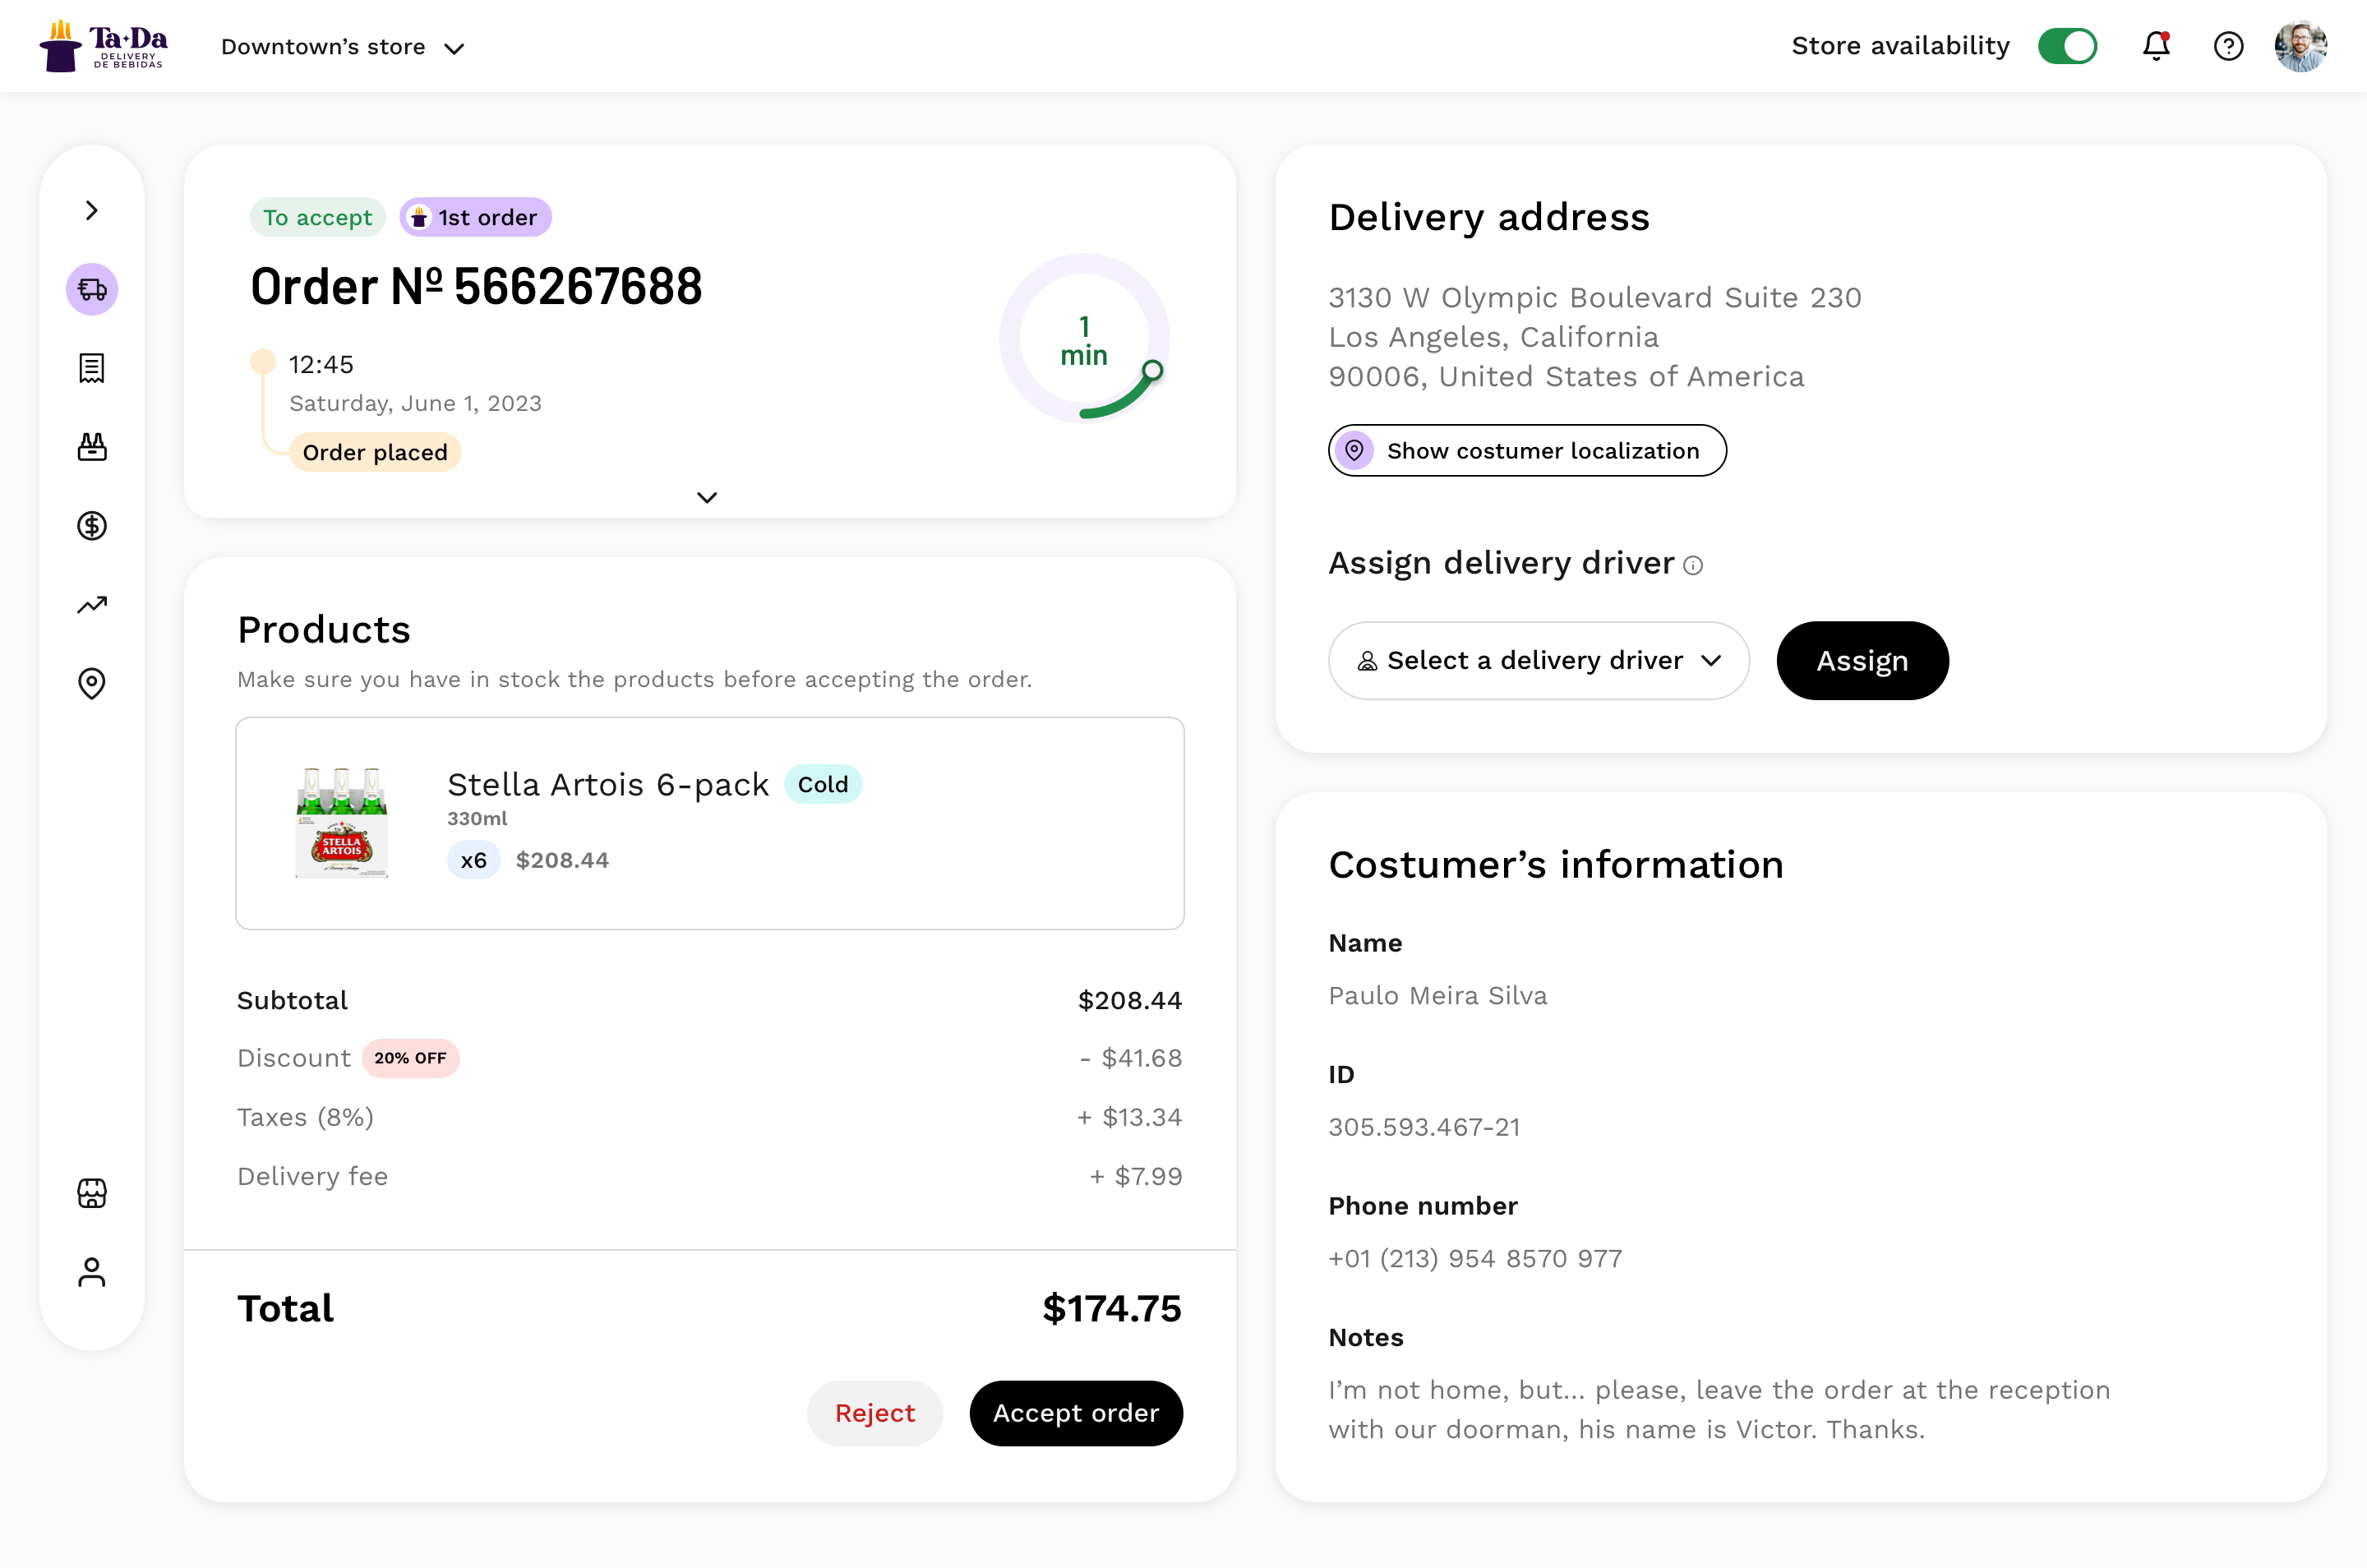
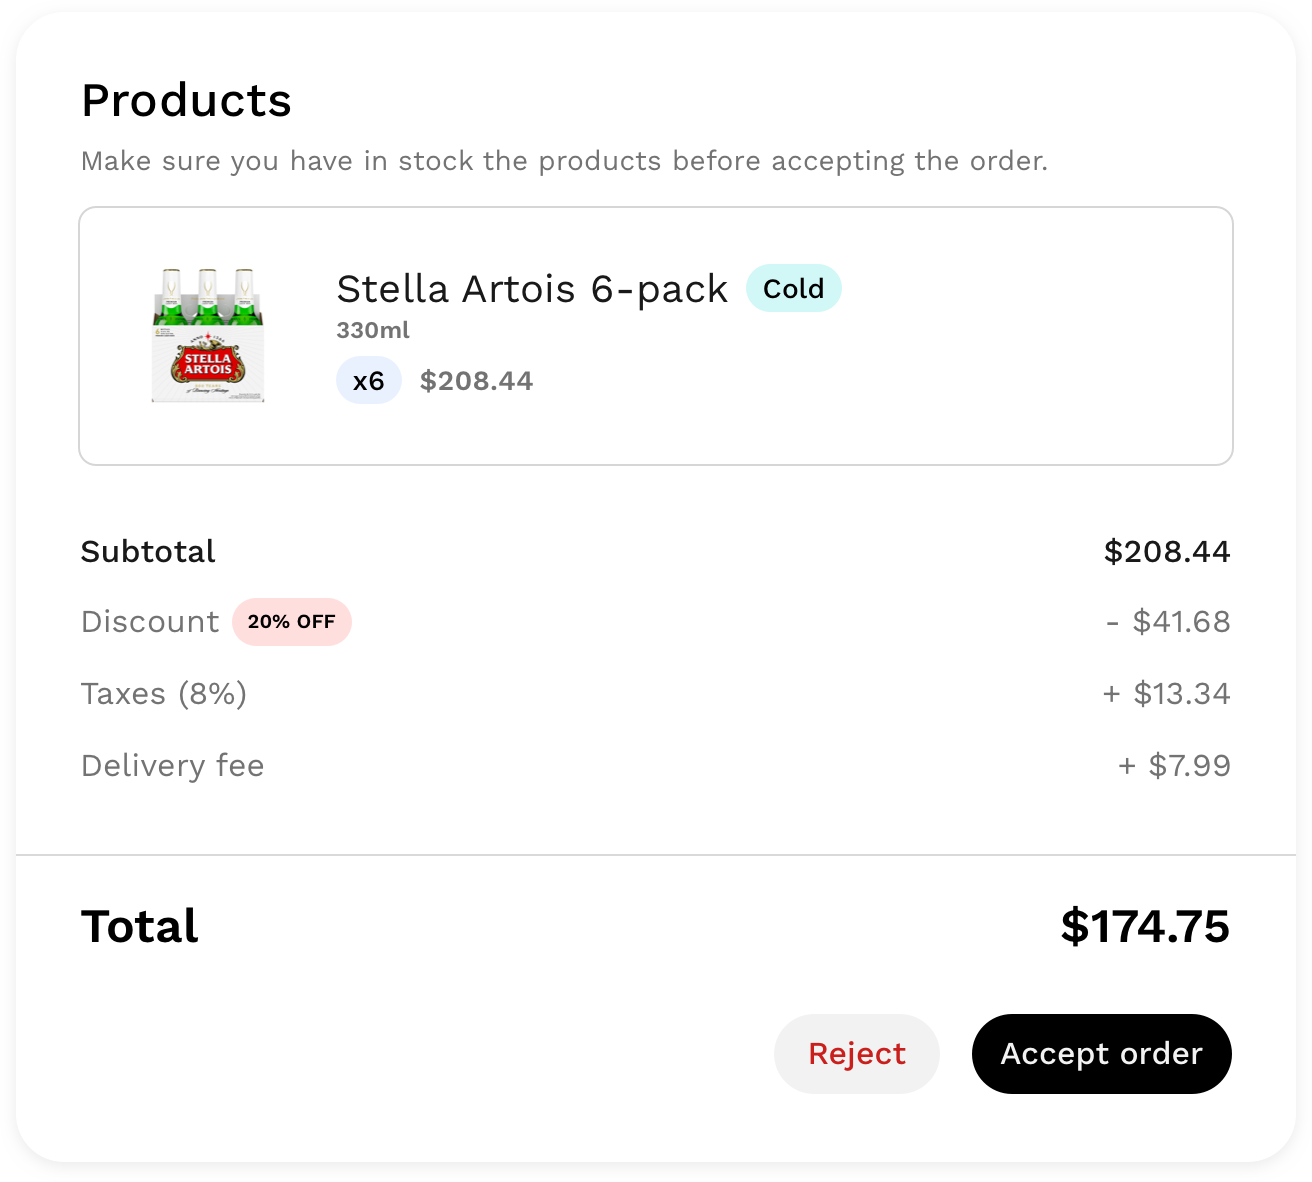
Before accepting, store managers get a stock reminder, each item with its quantity, and a Cold tag where it applies. The price walks from subtotal to total (discount, taxes, delivery fee), so the decision is made with the full numbers.
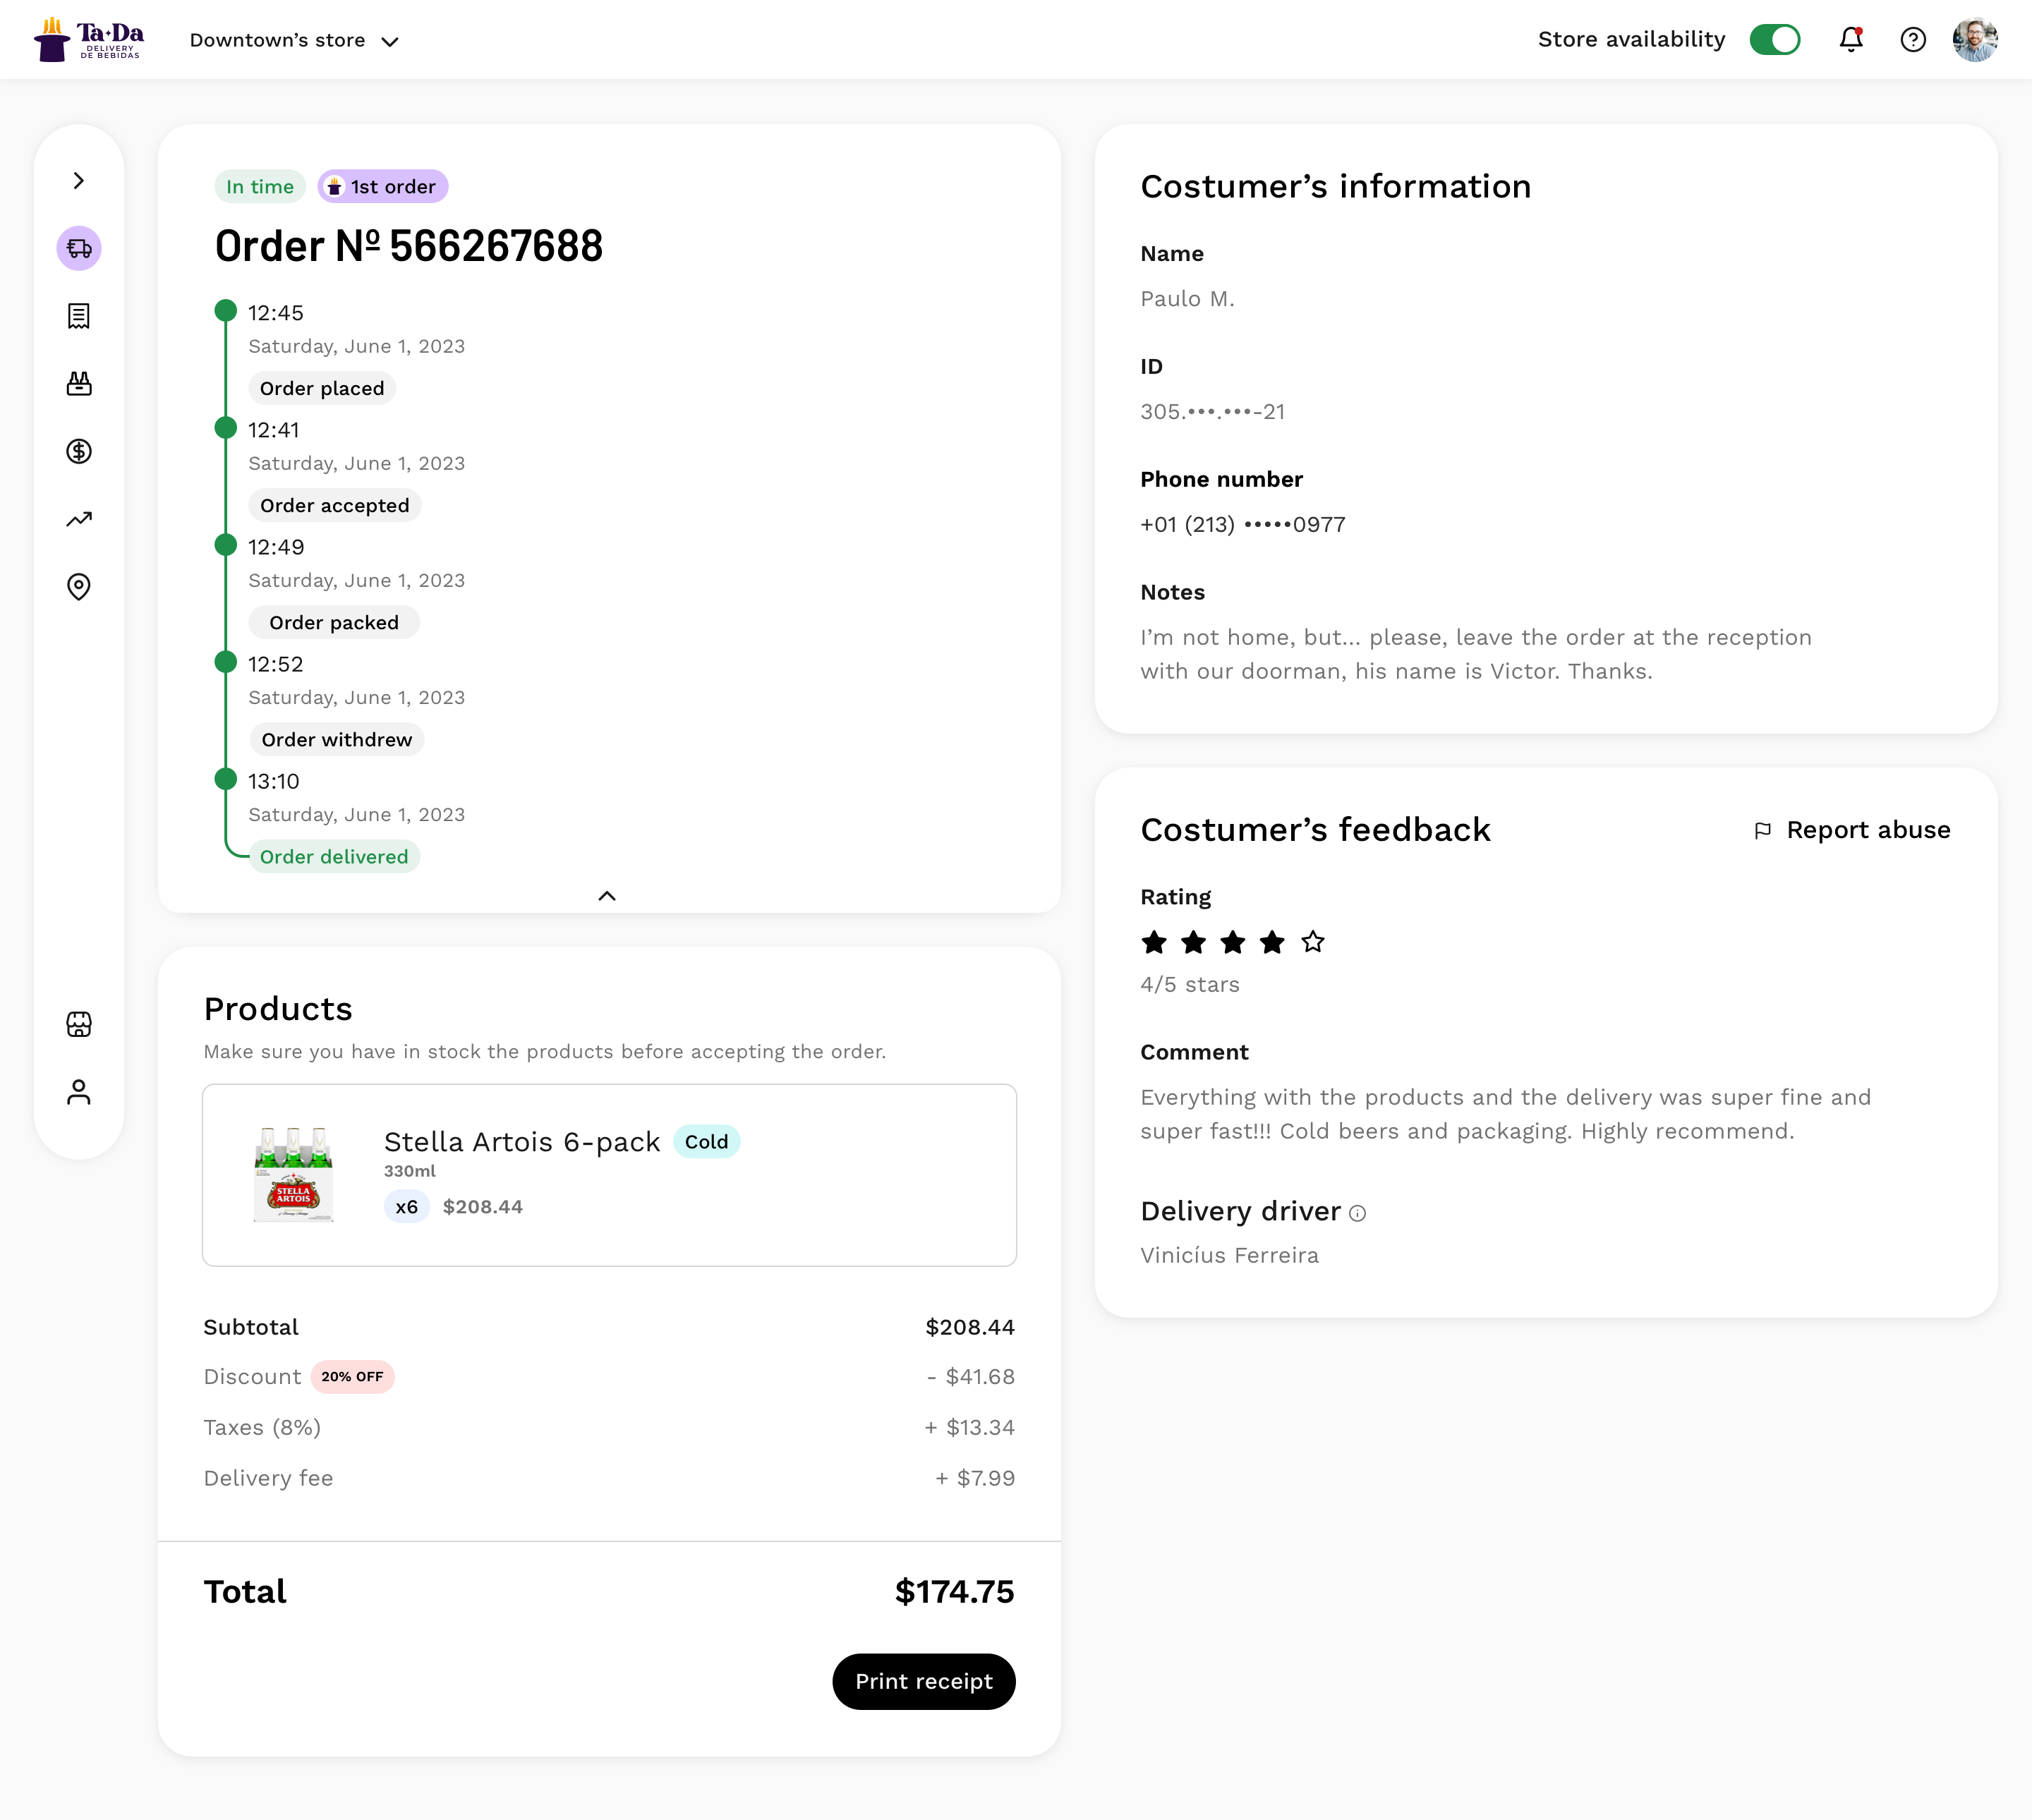
Order history sits collapsed by default. A usability test showed that an open history made product information harder to reach. As a store manager put it in the follow-up interview: “It makes it harder to access the product information about the order.”
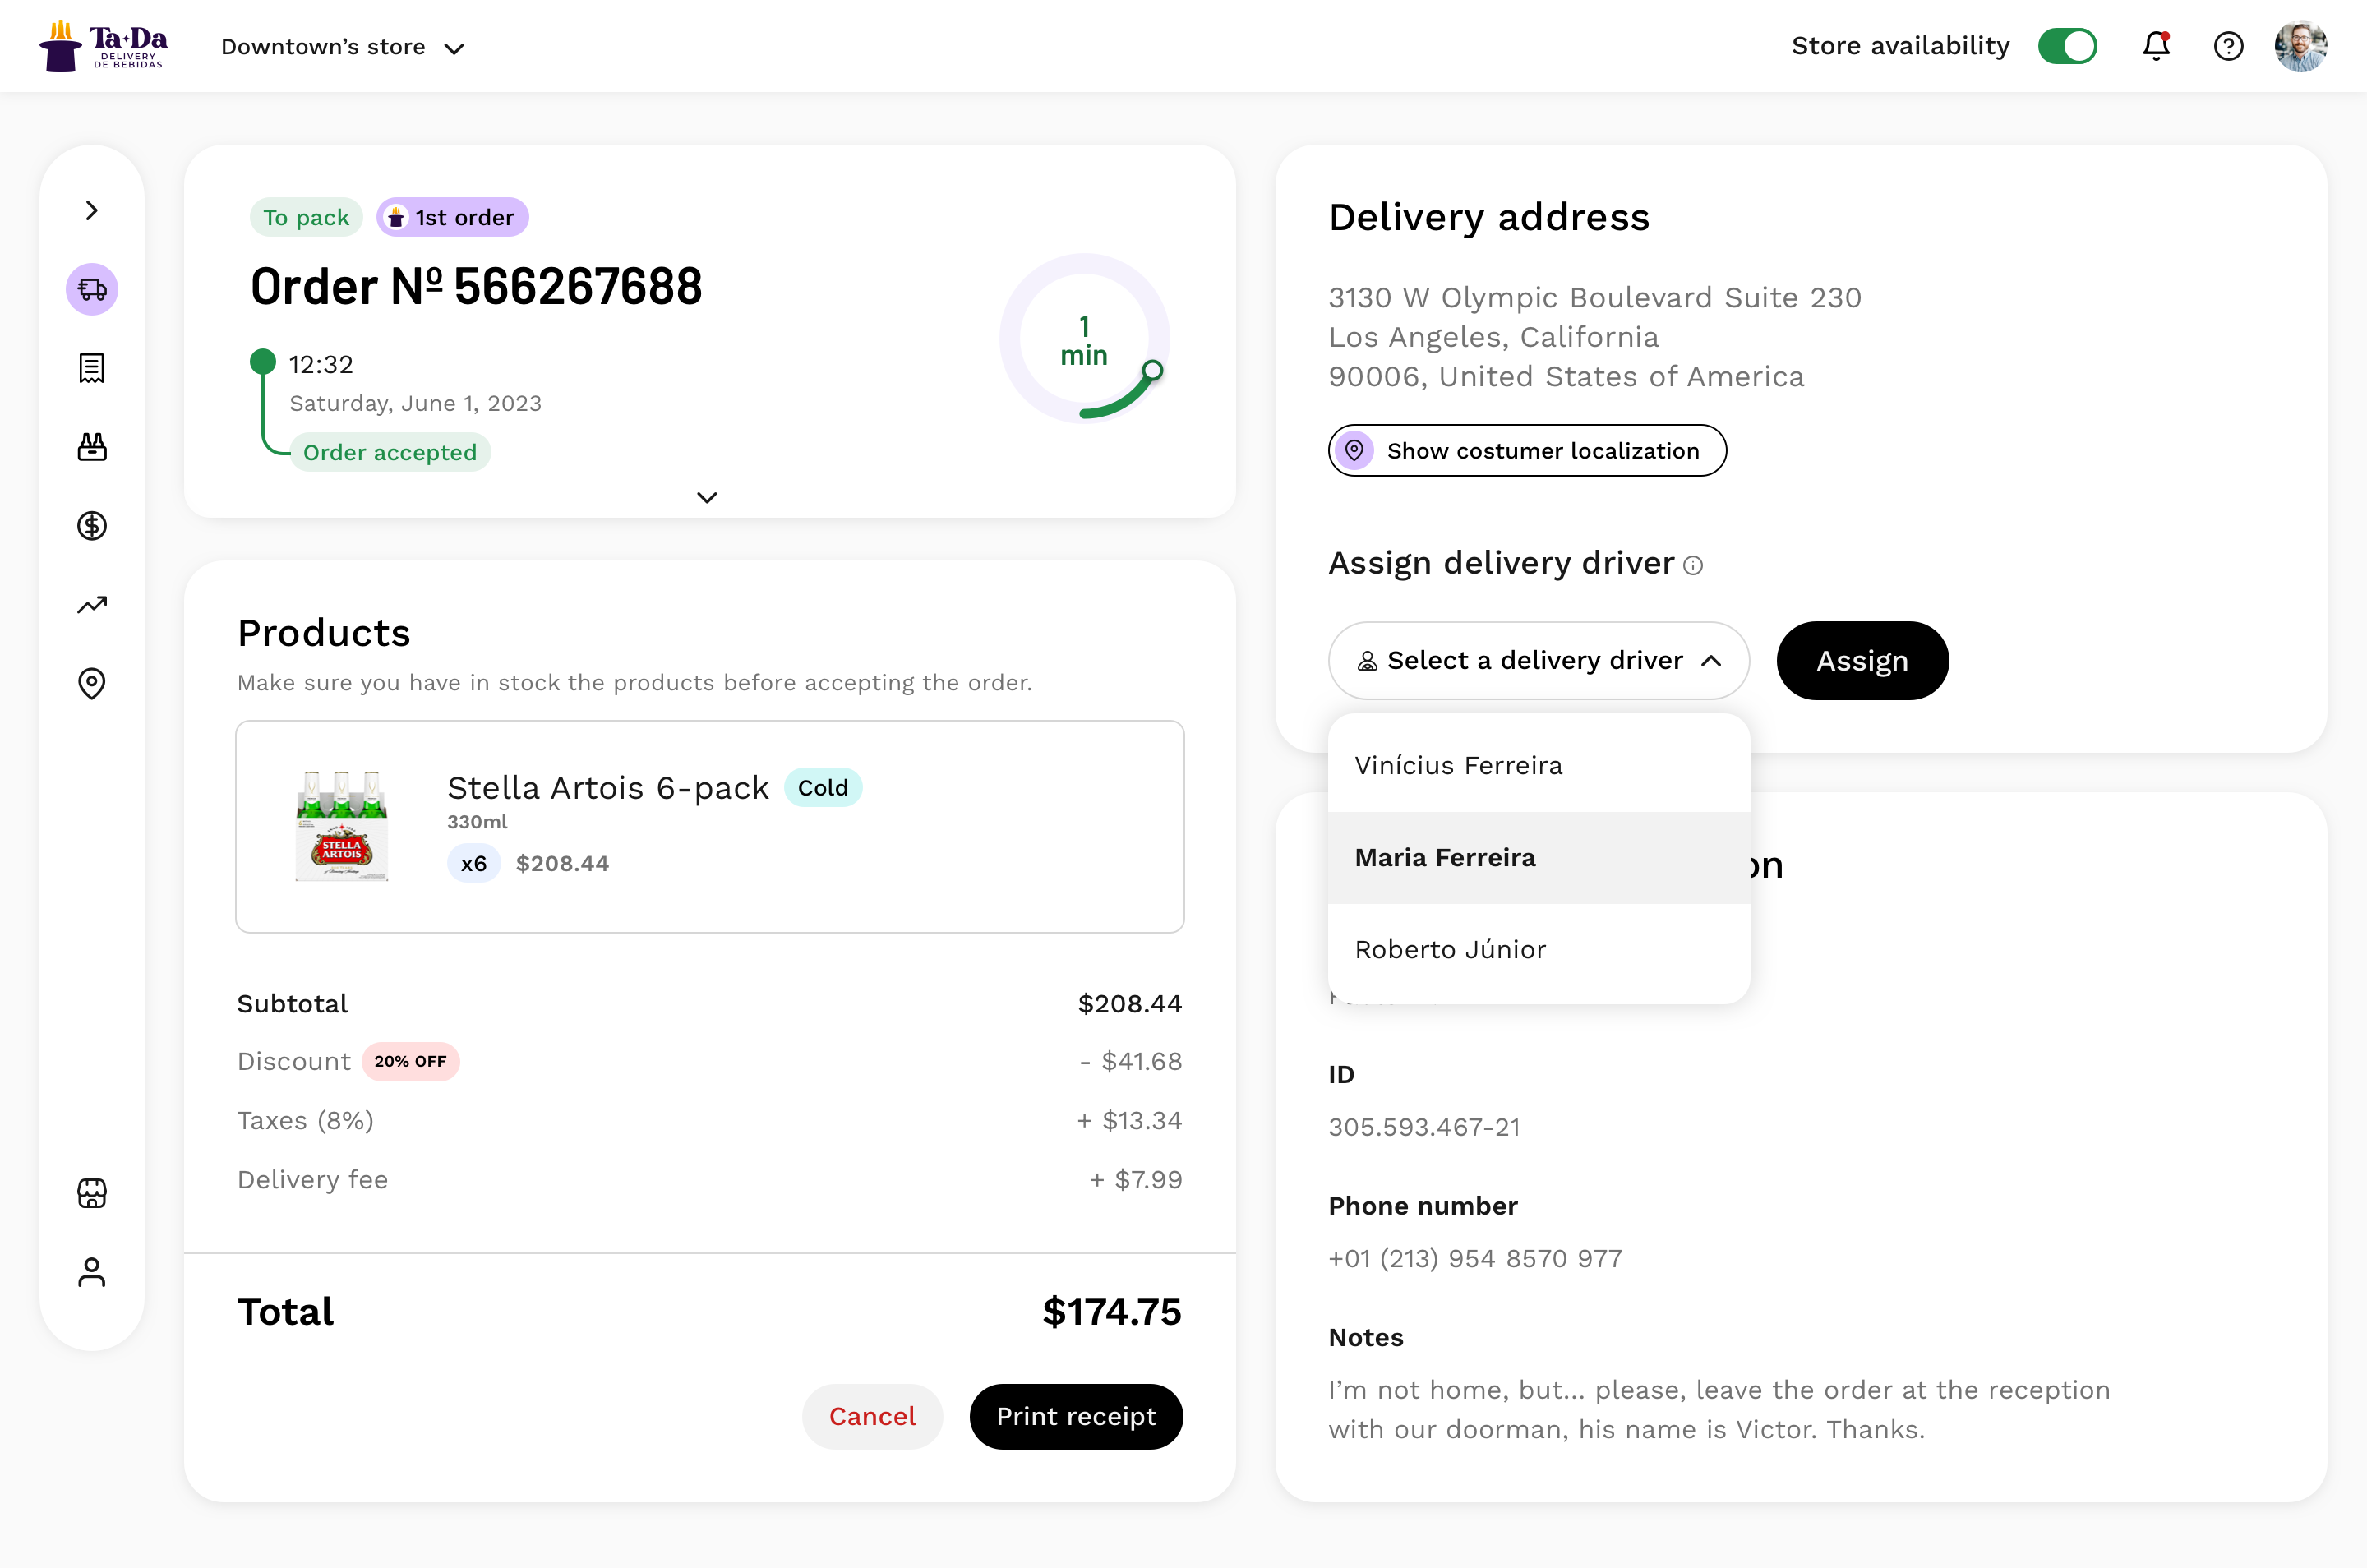
When the order is ready, the store manager picks a delivery driver from a dropdown and assigns it. The delivery address and customer location sit right above, so the handoff happens in one place.
Store managers see what they need to hand over the order: a shortened name, a masked ID and phone number, and the customer’s notes. The rest of the personal data stays out of view.
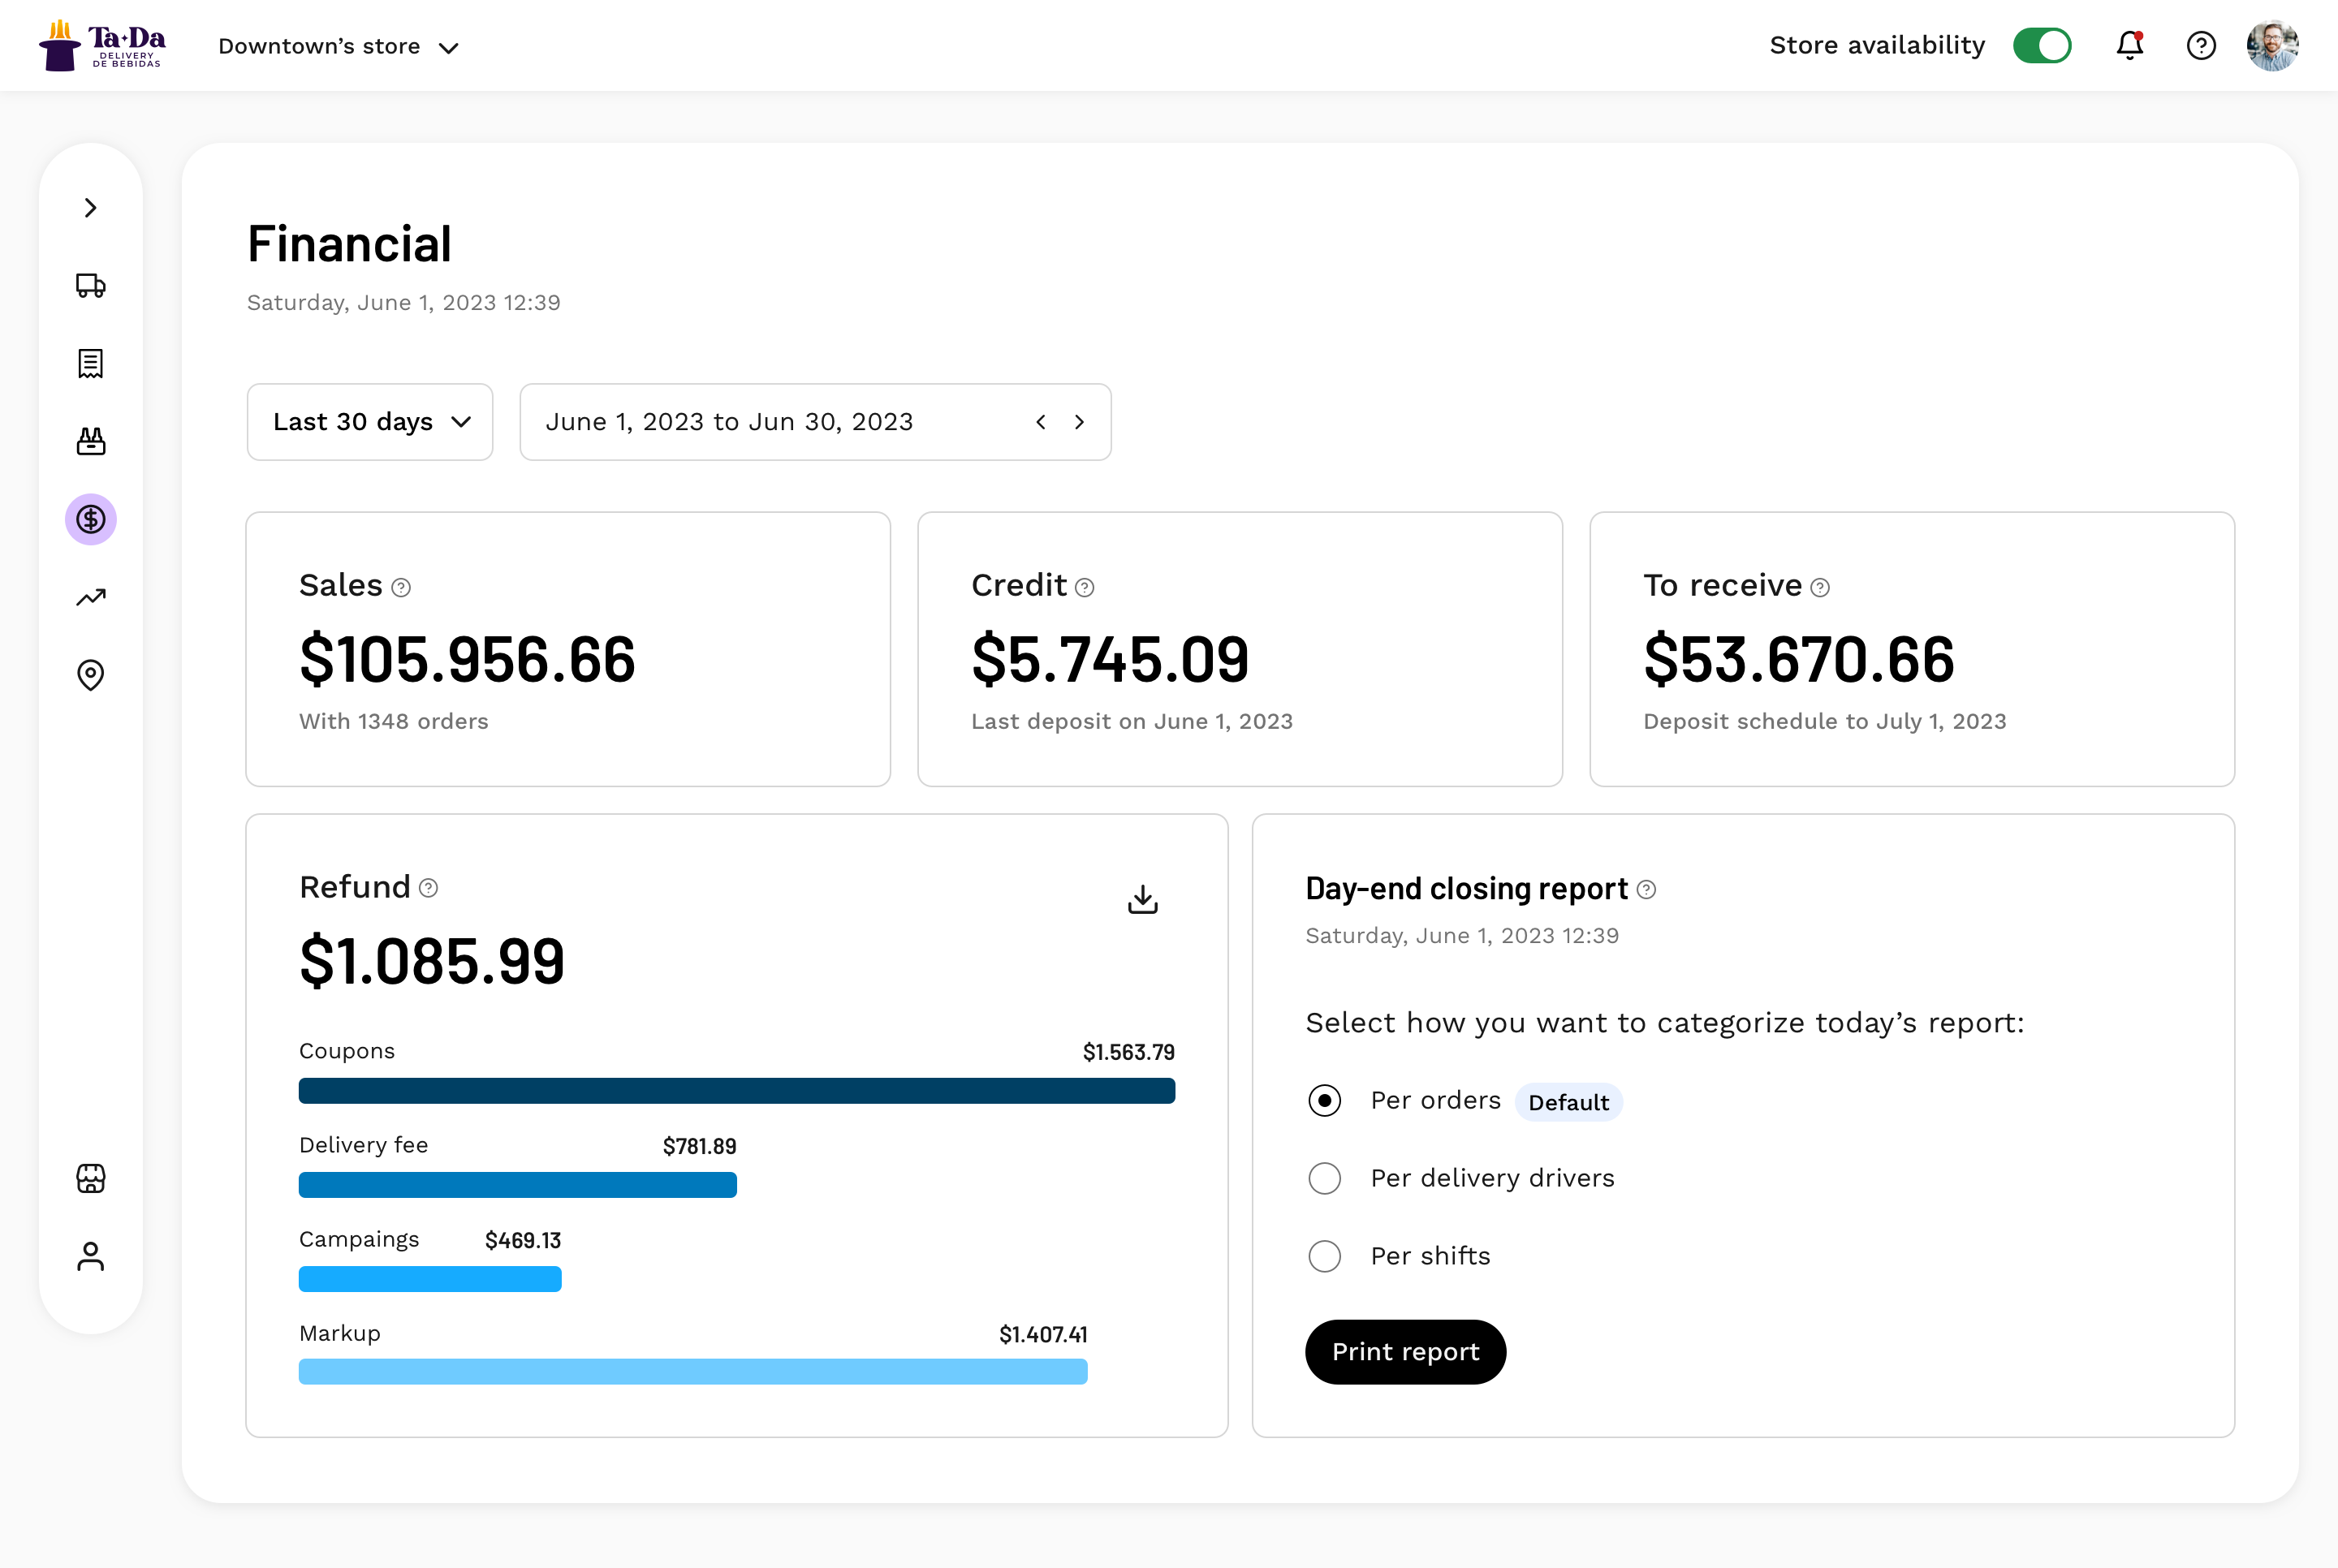
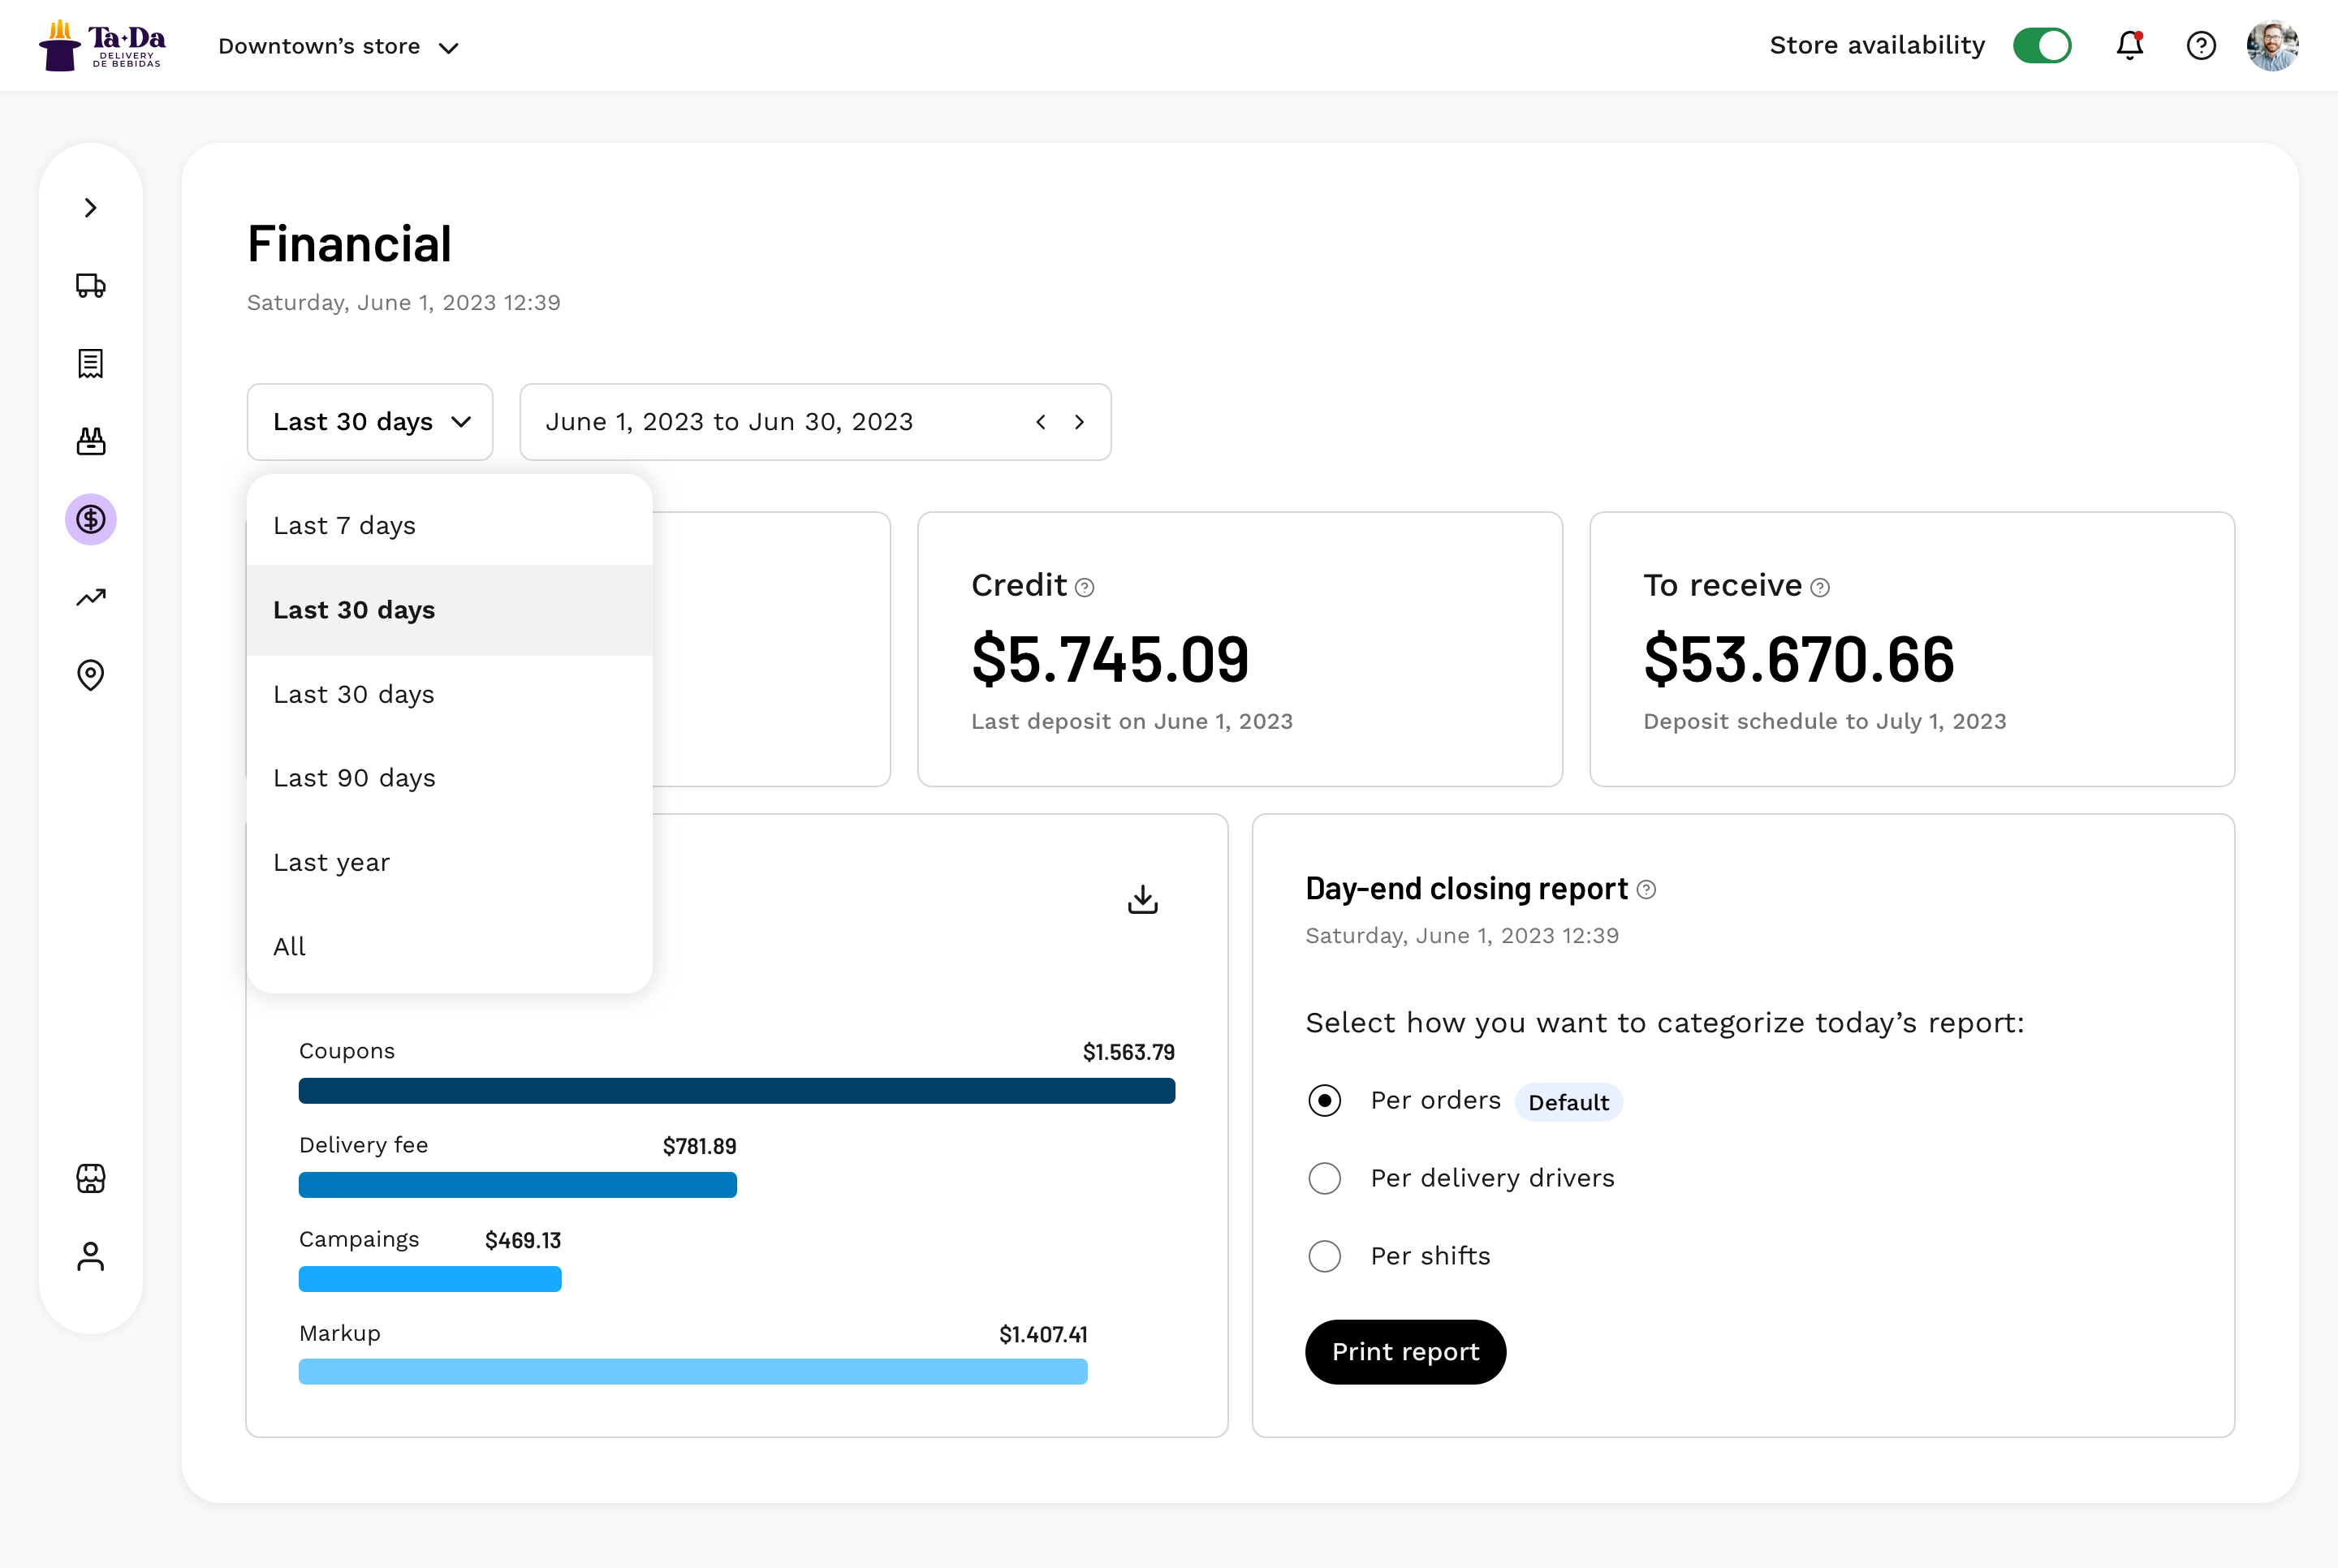
Payments in the BEES ecosystem are complex, so I broke the refund down by type. Store managers see what kind of refund they are getting, not just a total.
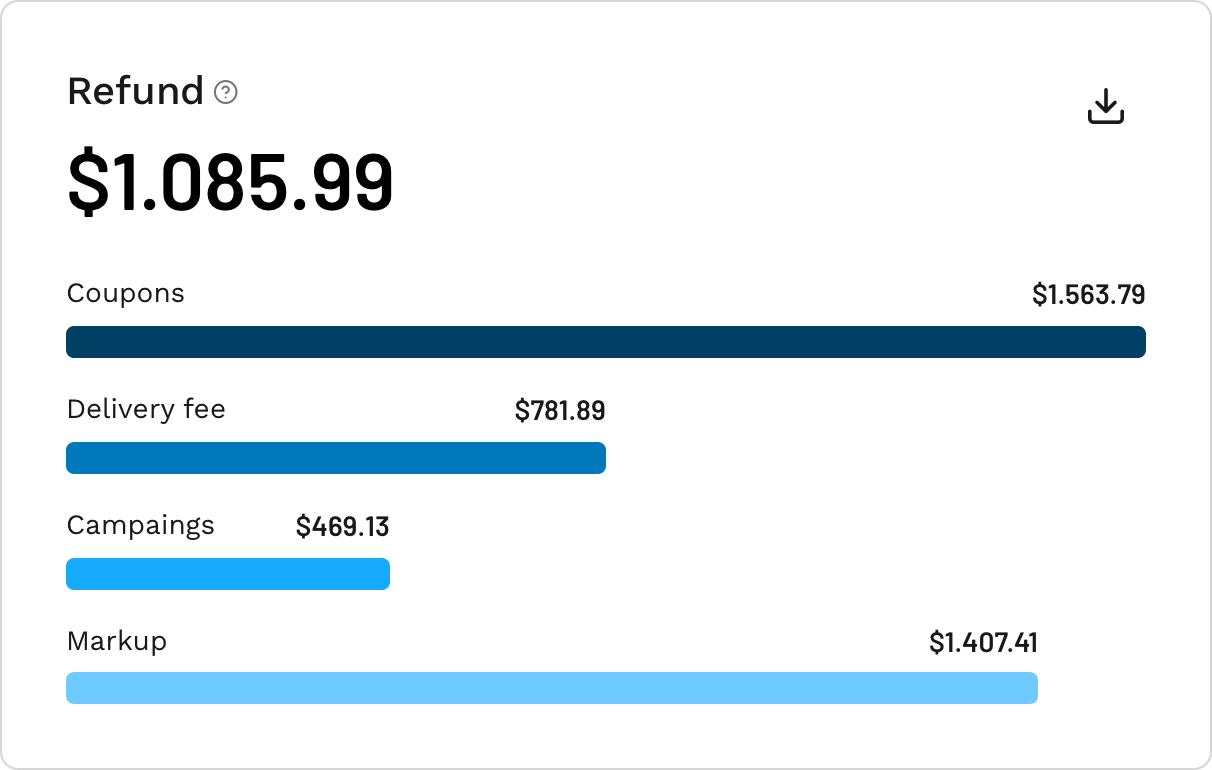
Refund total split into coupons, delivery fee, campaigns and markup
A closing report has to fit each store’s routine. I let store managers
choose how it’s grouped.
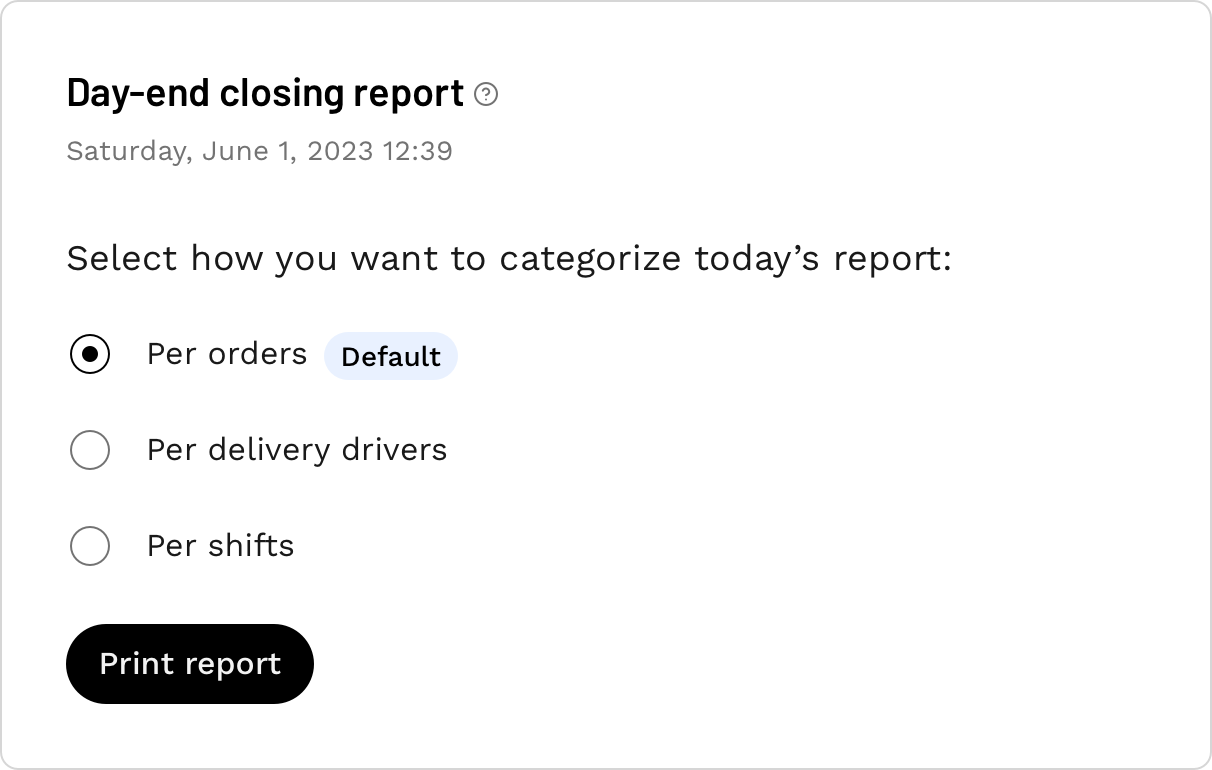
Day-end report: choose per order, per driver or per shift, then print
I kept the metrics clean and informative: sales with the change from yesterday, total orders, and an eye icon to hide the value. Built for better-informed decisions.
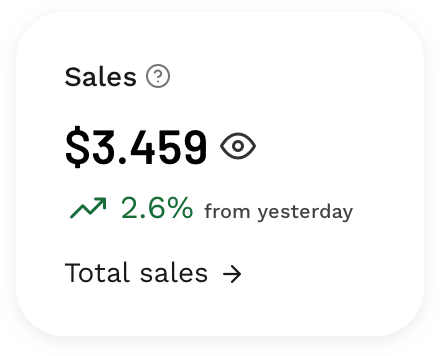
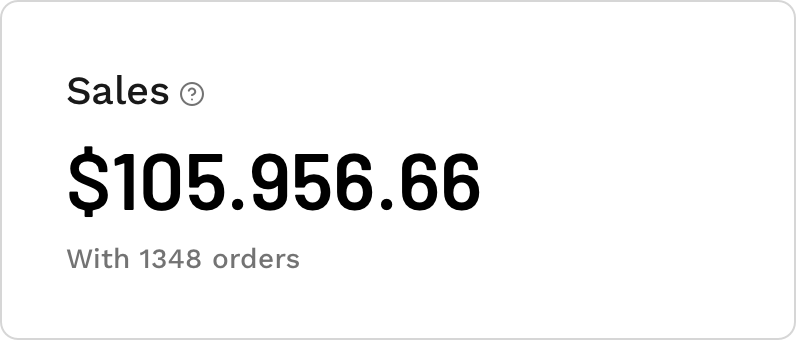
Flexible sales card: total orders and performance vs. the day before
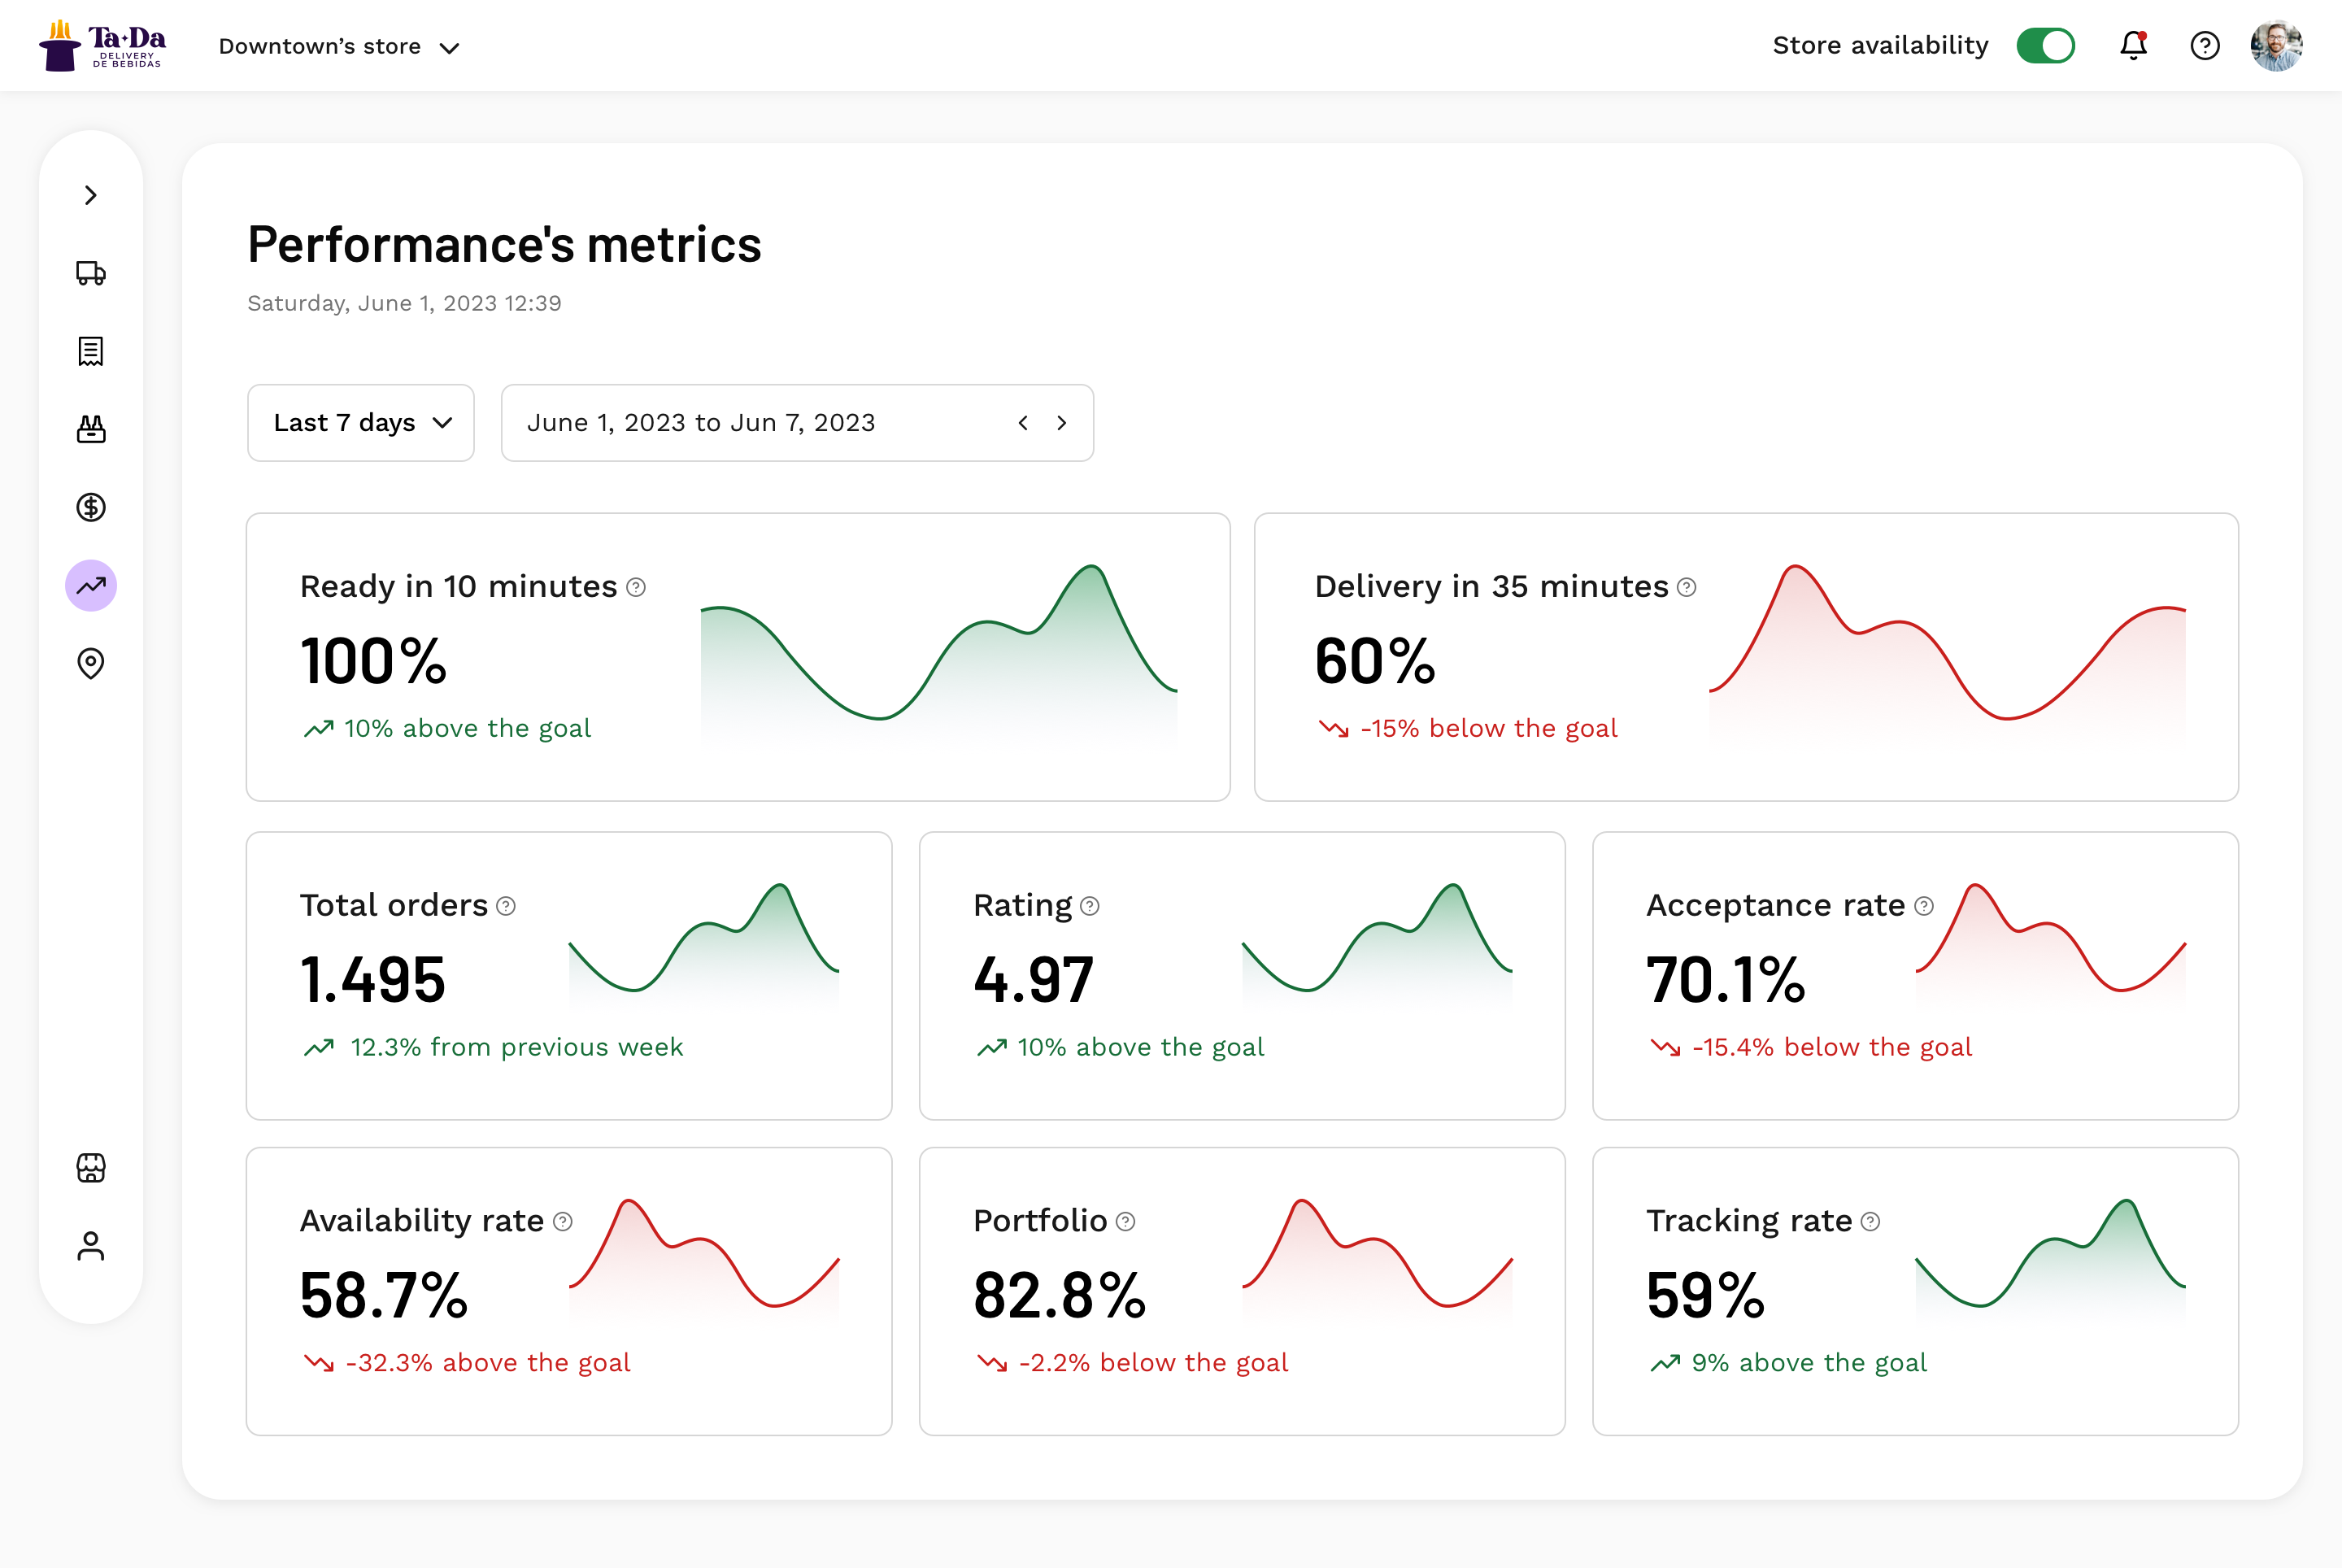
Comparing periods is a must-have for retail, so I let store managers set a custom date range and narrow down exactly the data they are hunting for.
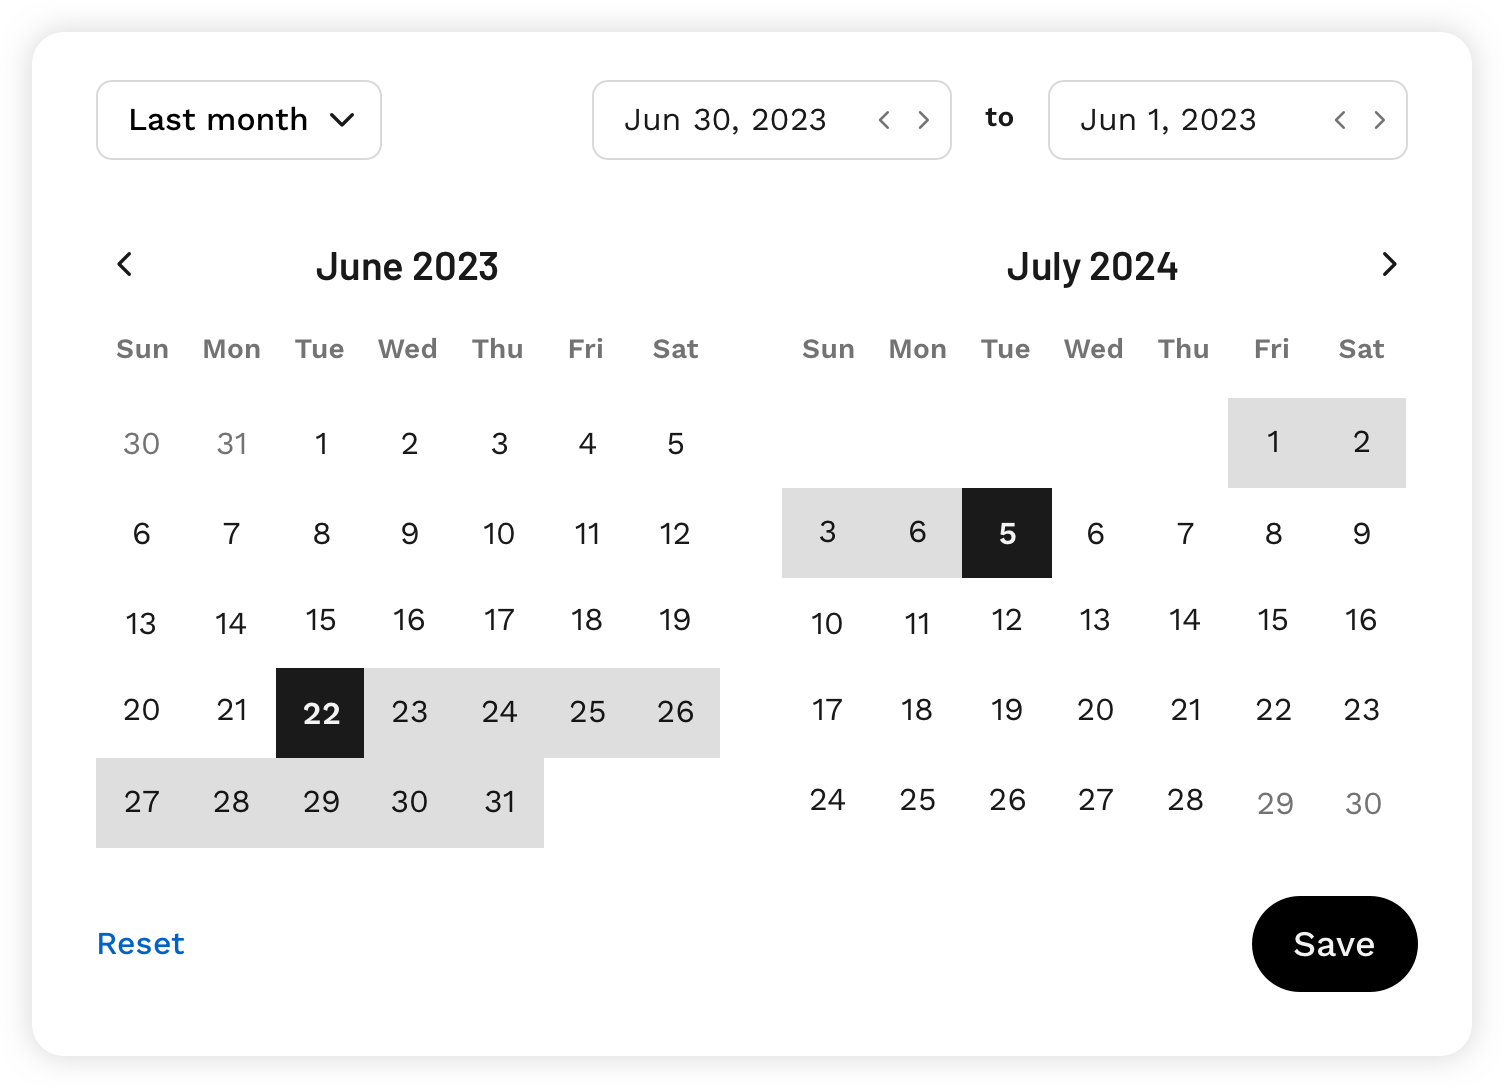
Custom range: two calendars, start and end dates, reset and save
Not every question needs a custom range. Presets get store managers to the answer faster, whatever they are trying to understand.
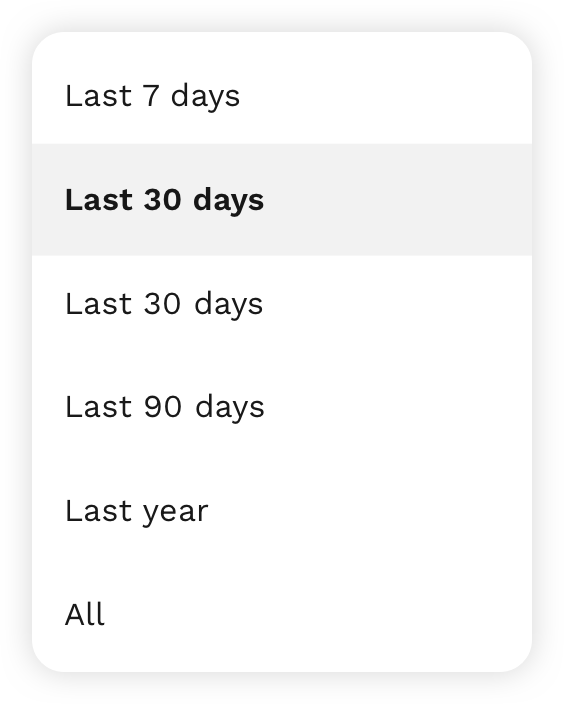
Presets: last 7, 30, 60 and 90 days, last year, and all
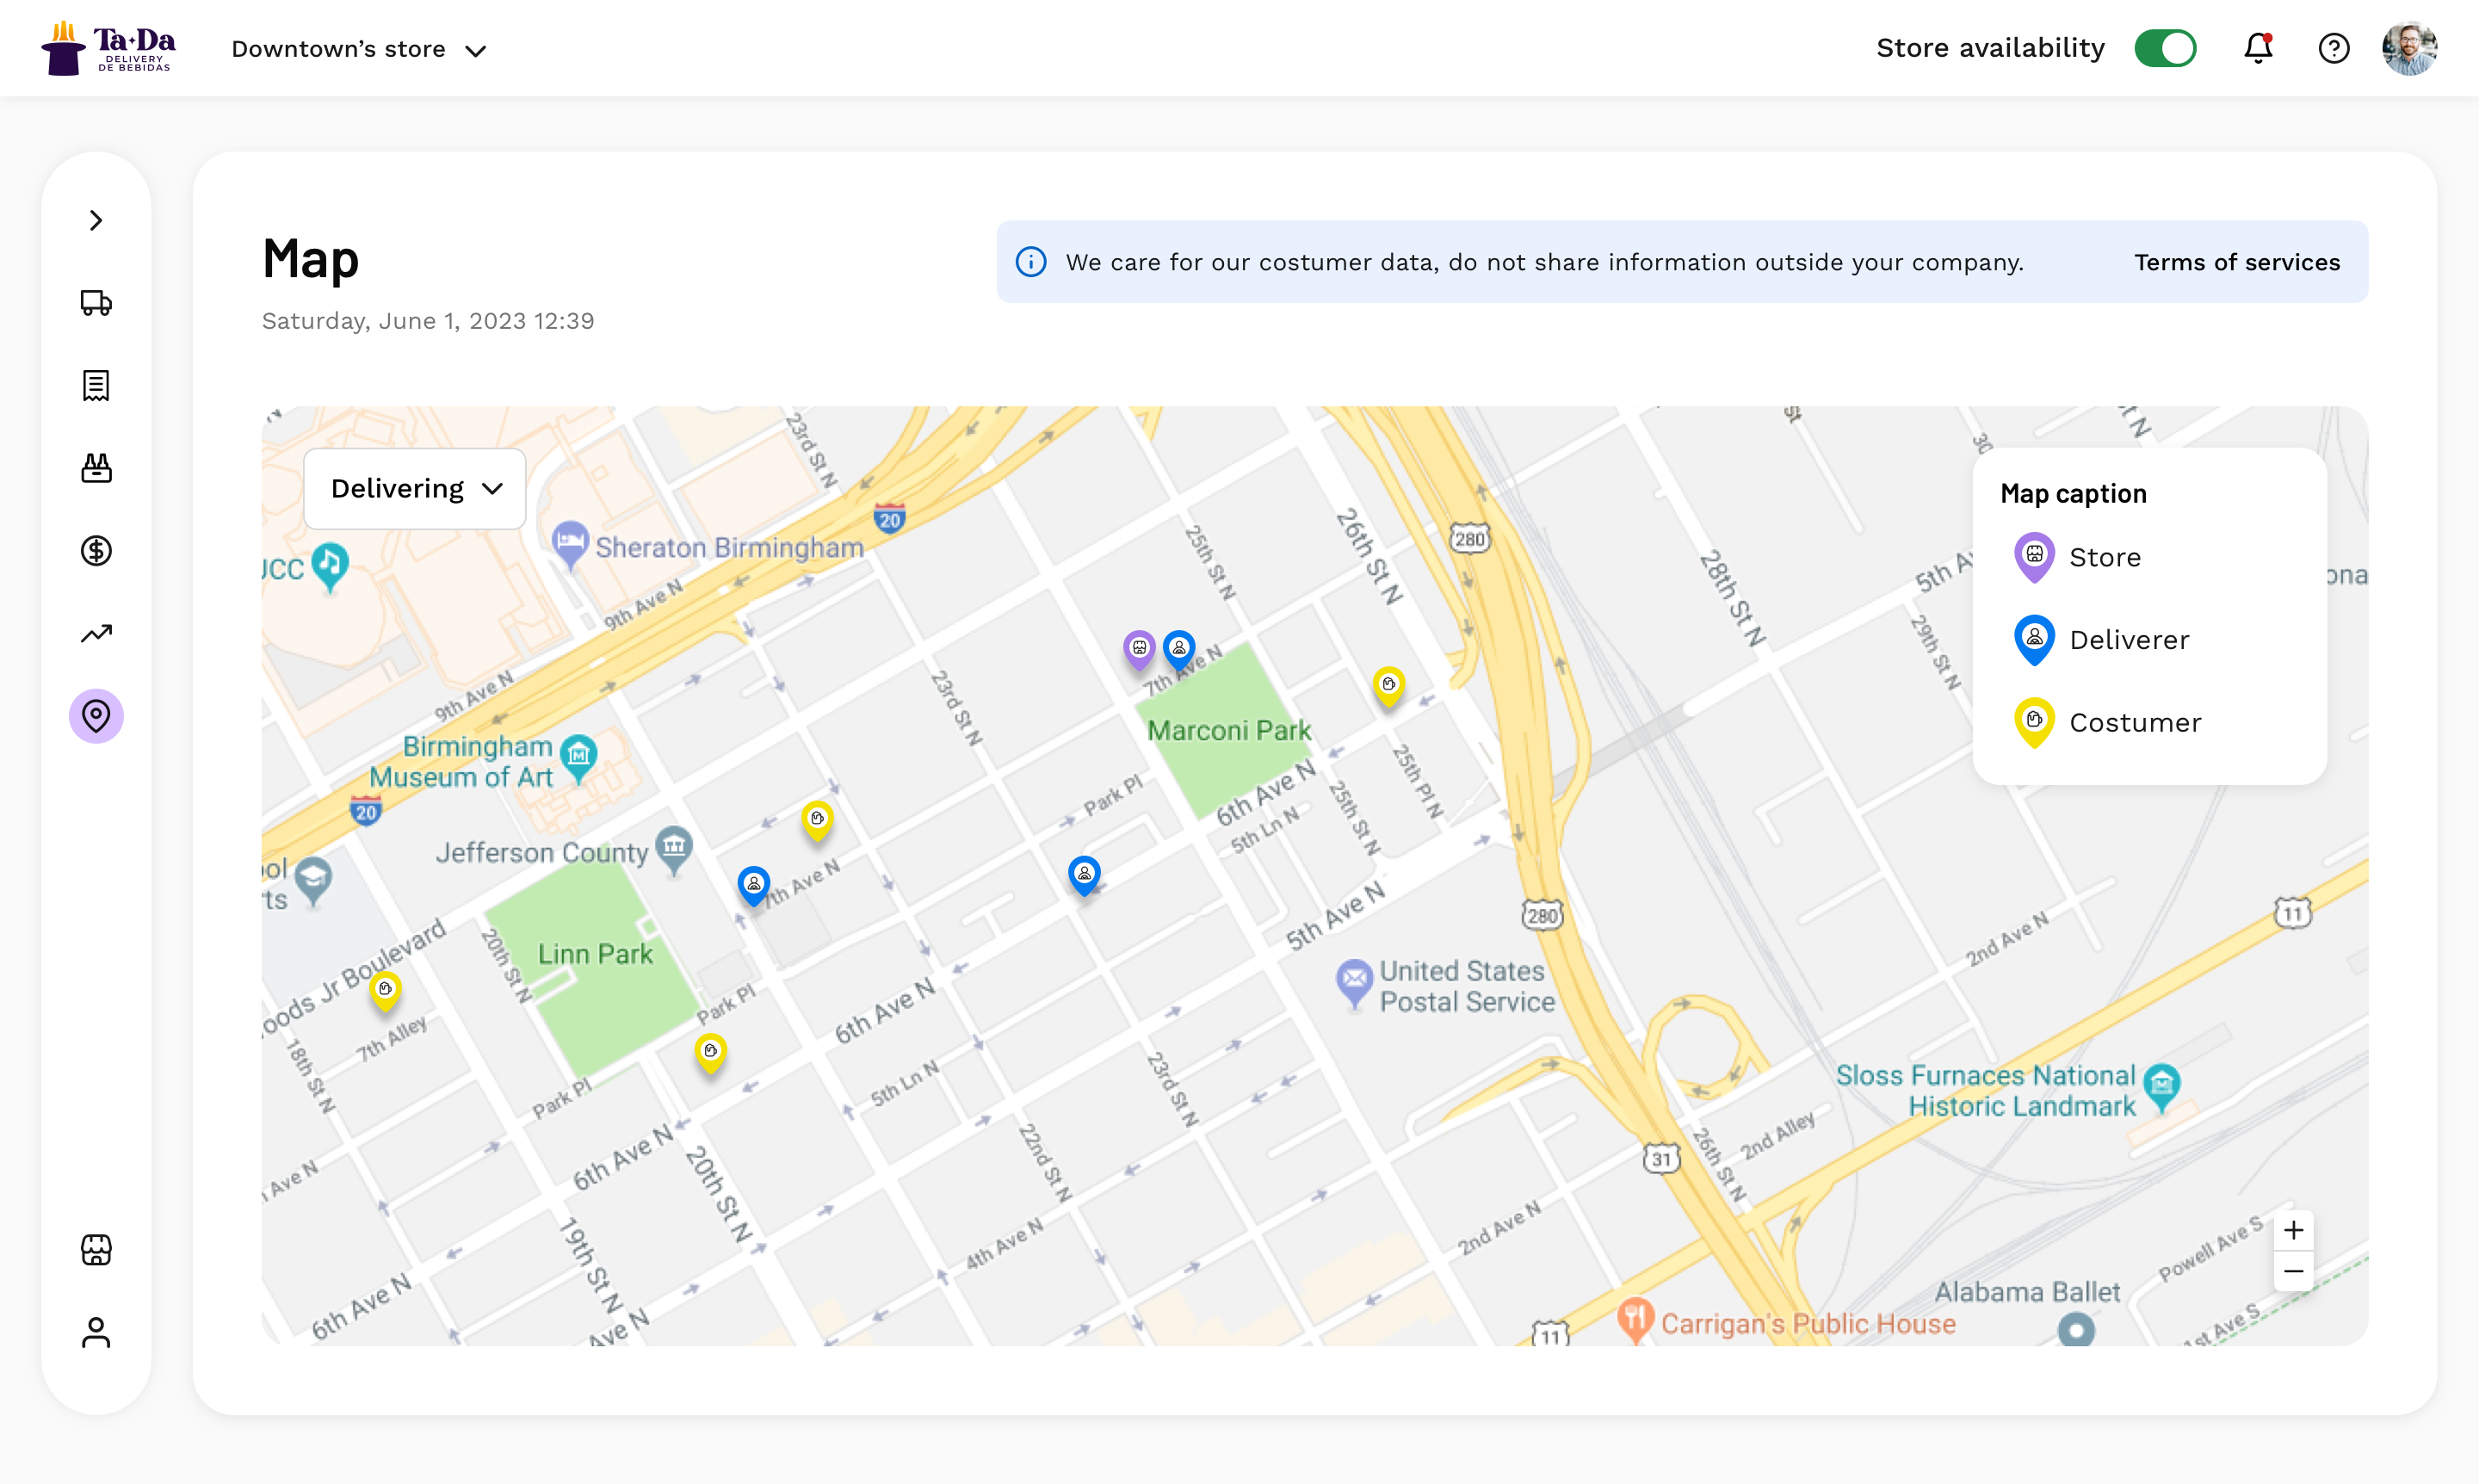
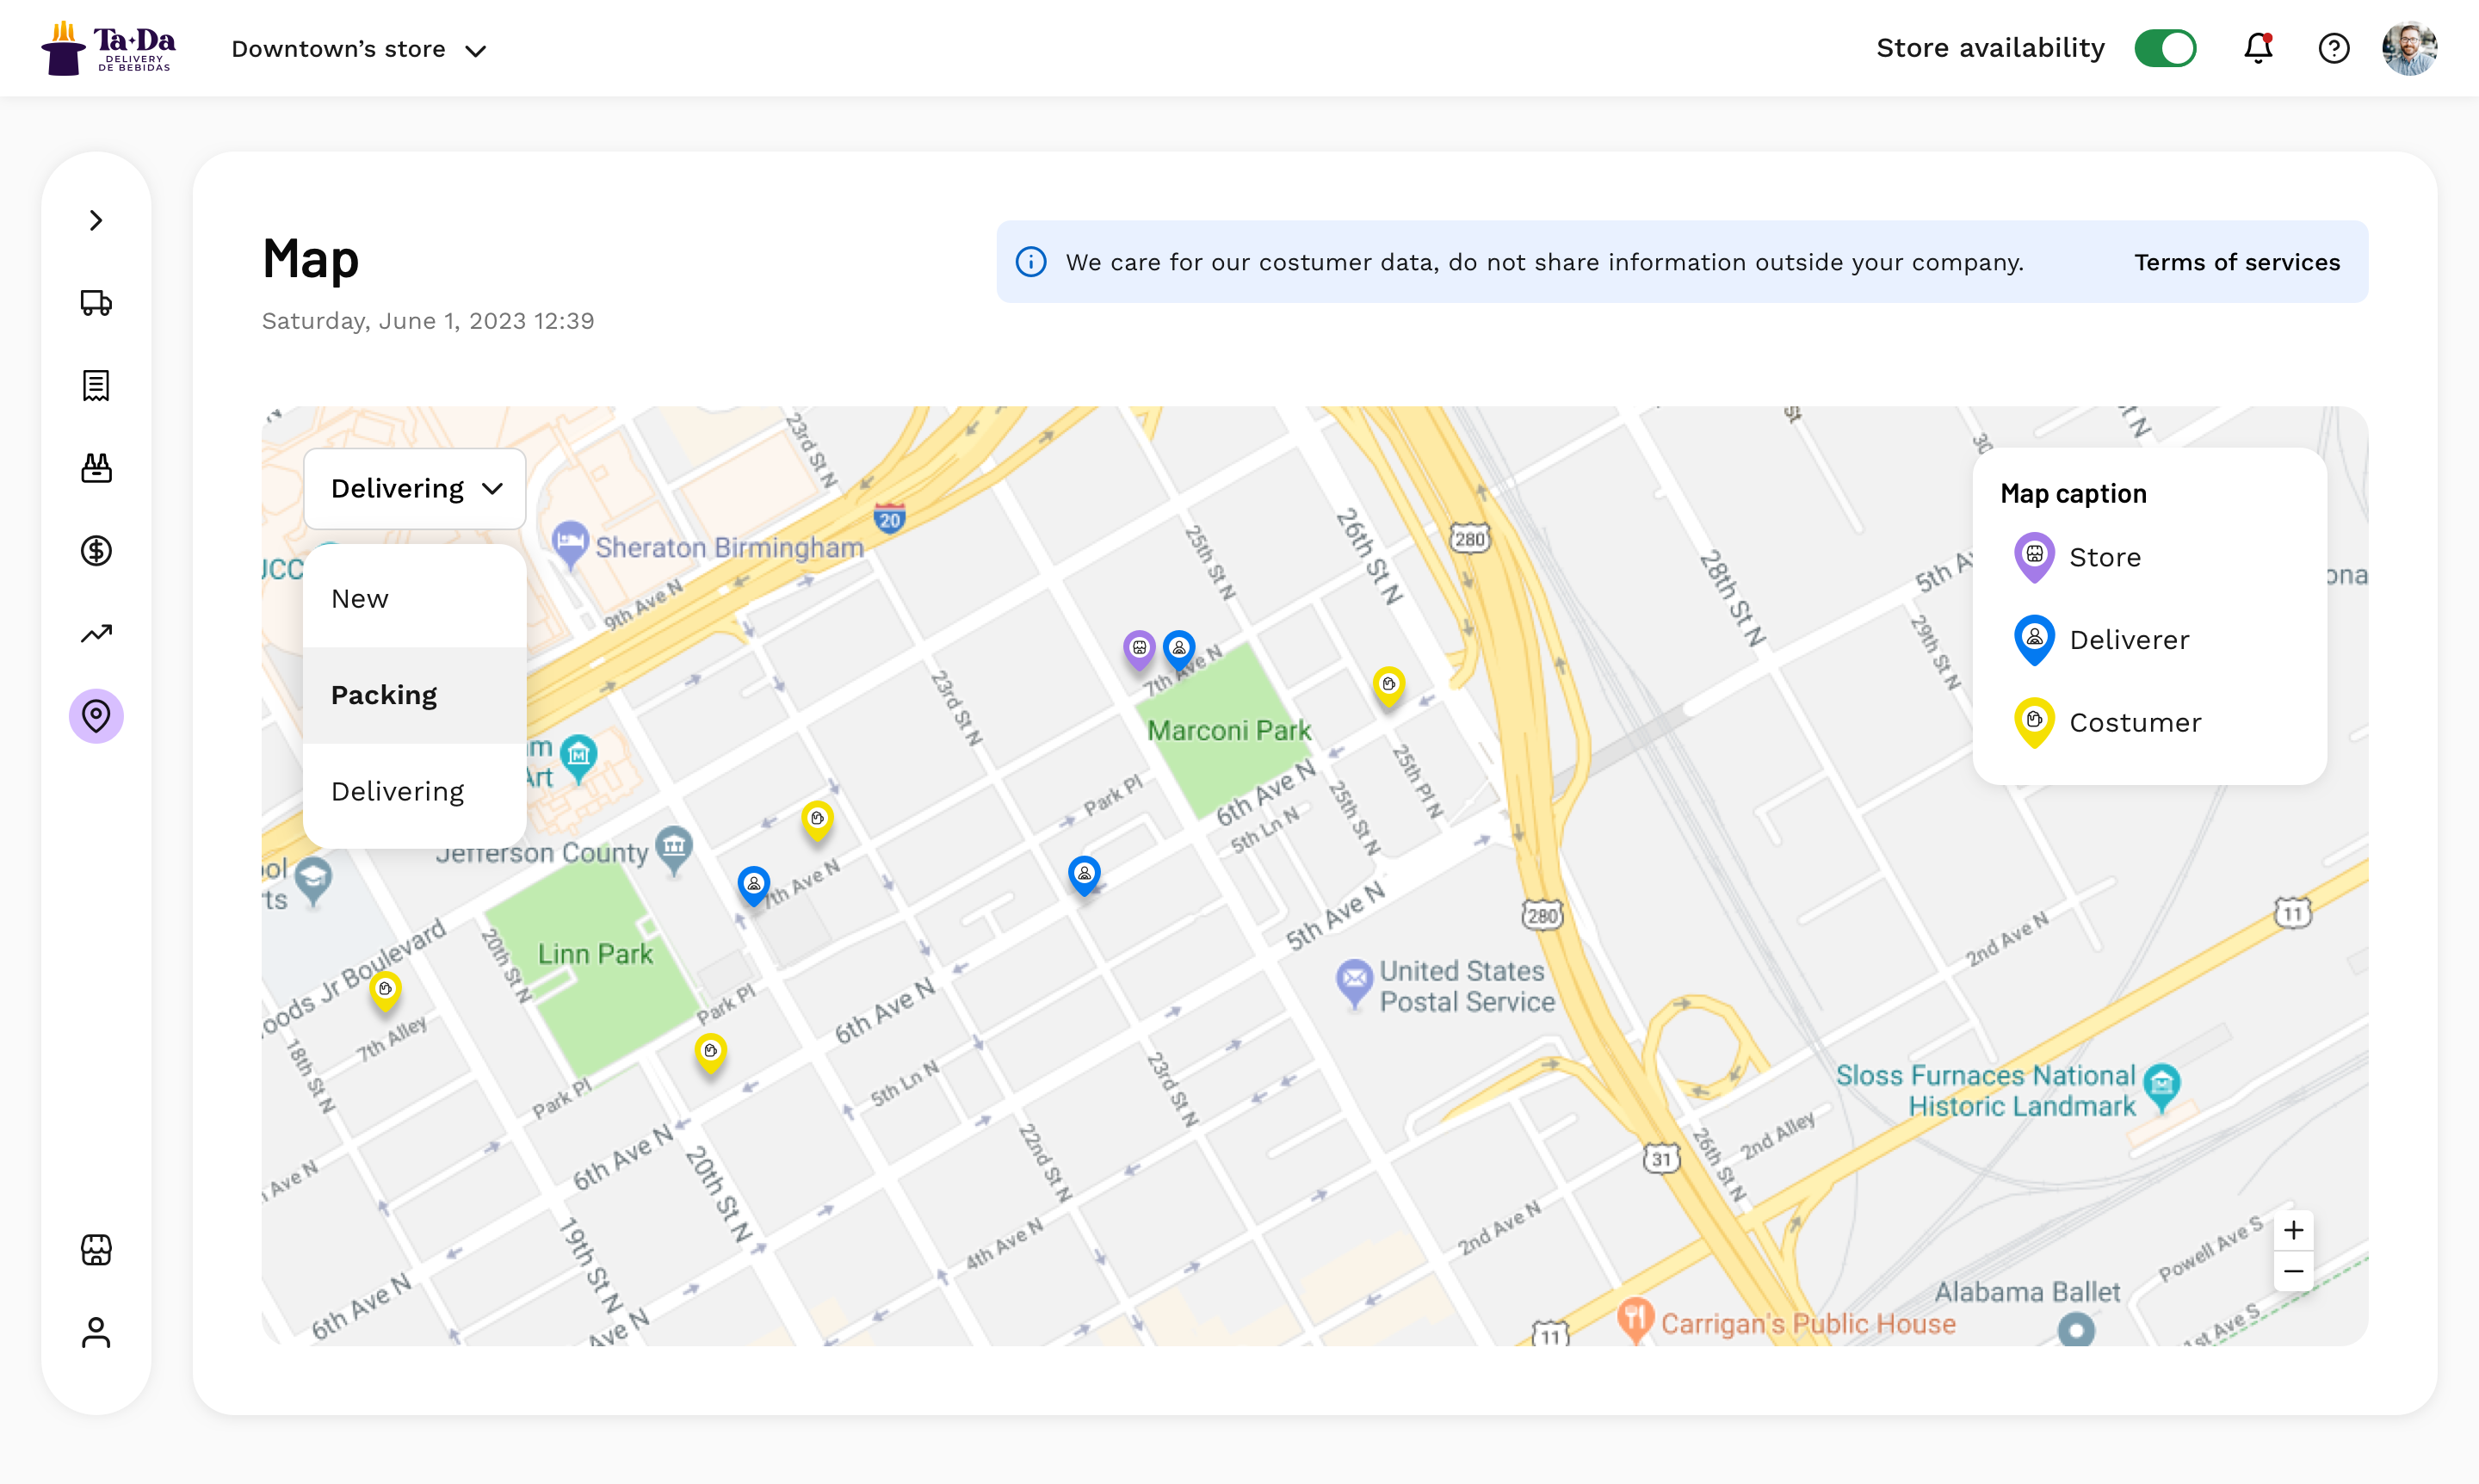
The map has a status filter with the same 3 stages as the orders board. Store managers can see where the store, the delivery drivers and the customers are, then plan the next deliveries without leaving the map.
Three kinds of numbers, each with its date: what we measured with store managers while I was on the project, what TaDá Delivery’s head of design reported after, and public AB InBev figures on where the platform went.


Platform launched in 13 countries in Latin America and South Africa.
Public figures from AB InBev reports, 2023–2024.
AB InBev-owned stores and external partners, managed by store managers and admins.
About half the time on the main tasks, compared with the two previous SaaS tools.
Reported by TaDá Delivery’s head of design (June 2023).
Clarity and trust, rated by 30 store managers.
Usability tests (Nov 2022 – Jan 2023).
 An MVP is a hypothesis,
I prepared the test: script, tasks and hypotheses. The team ran it in production, in Mexico City. It gave me the highest fidelity possible and evidence to confirm or refute my hypotheses.
 Make the problems visible,
Two 1-hour sessions with every area of the product produced a shared list of 26 inconsistencies. It went into the backlog, and 22 shipped.
 A solution needs a
I used to go straight to the point and skip the context. With two design stakeholders, one with a B2B lens and one with a D2C lens, I learned to prepare the story for each.
Customer support teams had to chase 150+ credit limit fields across a mainframe, screen by screen, while handling live...
Read case
Navigating Australia’s complex geography, unlocking inaccessible customers and reducing operational waste.
 Read case



 partner.tada.com